Folks, I apologize for going months between updates to this free site, however it has been a busy few months for me. Nothing really earth shattering has happened in the markets, even the recent “uptick” in the indexes is in question and really wasn’t worth reporting on until now.
Before we talk markets, let me GENTLY touch on some “admin stuff” and benefits usage that some of us are not tapping into, all opinion based and “the way I see it” type of perspective. Talk to HR/your agency benefits provider for official guidance.
NOTE: If the images in this post do not appear, your email provider may be blocking HTML or blocking graphics due to spam and other concerns. In that case, please go directly to my website to view this content: http://www.thefedtrader.com/
Also: Please participate in my end of year poll, link at the bottom of this post.
Admin Stuff:
It is currently “Open Season” (Nov 14 to Dec 12) and this is the only period in which federal employees can change their health insurance coverage for the coming year without having a qualifying life event, such as marriage or the birth of a child.
Important: This includes DENTAL coverage, which if you have a home with kids, you might be needing a cavity filled or some dental work done. Dental costs can add up quick. Personal story, I was a Delta Dental user for many years until my dentist just stopped accepting them, as did many other dentists in my area. I learned that he dropped Delta Dental after my emergency root canal surgery a few months ago. I walked out with a root canal done, associated X-Rays and other stuff performed, and a goodie bag containing a mini-toothbrush and some floss, and a few thousand dollars lighter in the wallet.
Lesson learned is that a “top rated plan” (per whatever Google research you wish to believe) is worthless if no dentists (or doctors) accept the plan. For the current open season, I spoke with my dentist, and other dentists nearby, and basically asked them “what plan would YOU choose.” I ended up choosing Metlife Federal PPO High plan, which (I believe) works for my situation and my location. FYI
A great Nov 21, 2022 article about open season and comparing FEHB plans is here: https://federalnewsnetwork.com/open-season/2022/11/open-season-exchange-2022-opms-edward-deharde-on-why-comparing-fehb-plans-is-critical-this-year/
Health Insurance:
As someone blessed to have “made it” to 6(c) retirement, with all the accompanying benefits that go along with it, the biggest and most important one is not the low-cost TSP, or the monthly check that never stops, or the annual leave cash-out…the most important one is the federal health benefits/insurance. Talking to colleagues, friends, neighbors, and others who work in the private sector, many at Fortune 500 companies in professional level roles, our health insurance is (my opinion) far better than most. In addition, when people “retire” from some of these companies they may loose some, or all, of their health insurance that make up part of their employment. If they go out to get insurance on the private market, they may face health exams, denials, or costly premiums due to common nuisances such as high blood pressure, issues with family history, and other stuff. Since many of the readers of this site are “retirement minded” you might take a look at OPM’s site, or read Dan Jamison’s FERSGUIDE, or read some of Chris Barfield’s articles, to stay abreast of benefits information.
EAP:
It has come to my now-retired attention, via buddies at numerous different agencies, that many folks just don’t know about EAP, or know what EAP can actually do for them. I had a recent conversation with somebody who told me “they” (his peers) would “never call EAP, for anything.” Since EAP is (apparently, my understanding…) run and managed by each agency and department differently, it may be beneficial to just call EAP yourself and find out what they can provide. EAP benefits typically extend to family members living under your roof, if the issue at-hand is linked to your employment. Some examples might be your shift work or a PCS move that is causing some stress and disruption on the kids or family. Typically EAP will set up sessions with an on-contract local counselor or therapist to help get things back on track. Check with your agency, but EAP is typically fully confidential.
USE OF health insurance:
Similarly, I spoke to another buddy, “older guy” like me now, but still on the job, who told me he “never” gets a physical or lab work done. No personal doctor, no “go-to Doctor” if he gets sick. “Too much trouble, plus it is expensive.” Etc etc. I was like “Bro, whip out that Blue Cross Blue Shield card [which you pay for…], bang in sick for the day (fully justified), and get a physical and some lab work done.” In sum, we have some of the best insurance in the world, lets make Blue Cross (or whoever) earn some of their keep. This is my opinion. We have no excuse. Sick leave can be used, and the visit should be covered by health insurance. Sorry to rant on this but what we could do at Quantico or FLETC at age 25 and what we can do at age 50, 55, are two different things. Stuff starts breaking and weird body aches seemingly appear for no reason.
Lets talk TSP, well lets talk about the markets and the TSP will take care of itself…
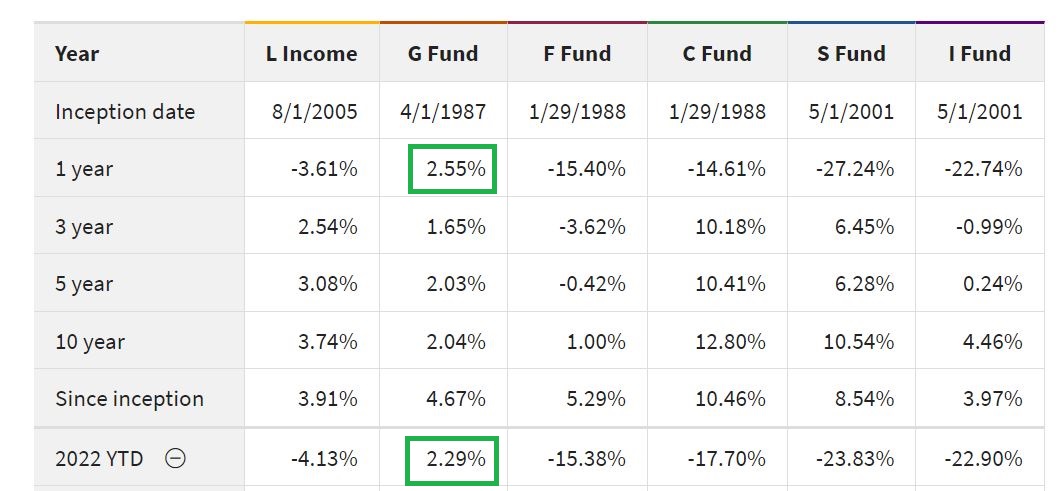
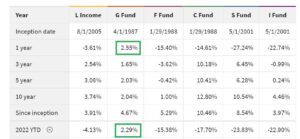
Bottom Line Up Front: I am 100% G-Fund, however I am retired and am even more conservative at this point with my TSP.
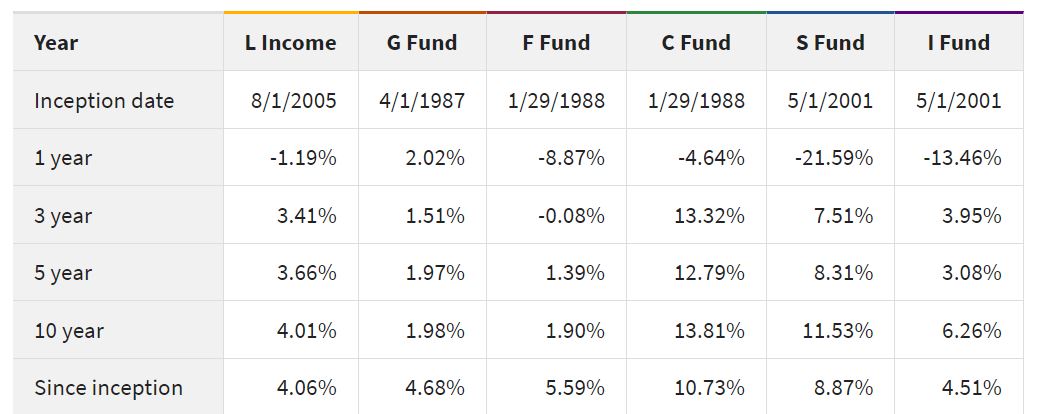
The best performing fund, Year to Date, is, drum roll, the G-Fund. The boring, often bullied, lackluster, “never will beat inflation” G-Fund, is the only positive return, Year to Date:
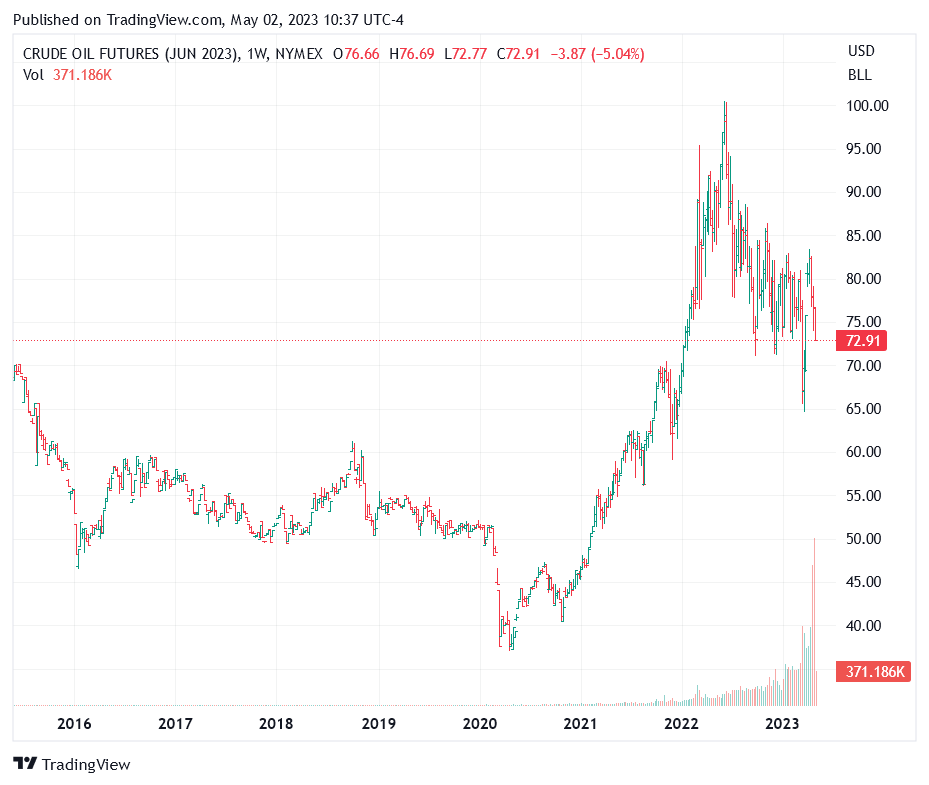
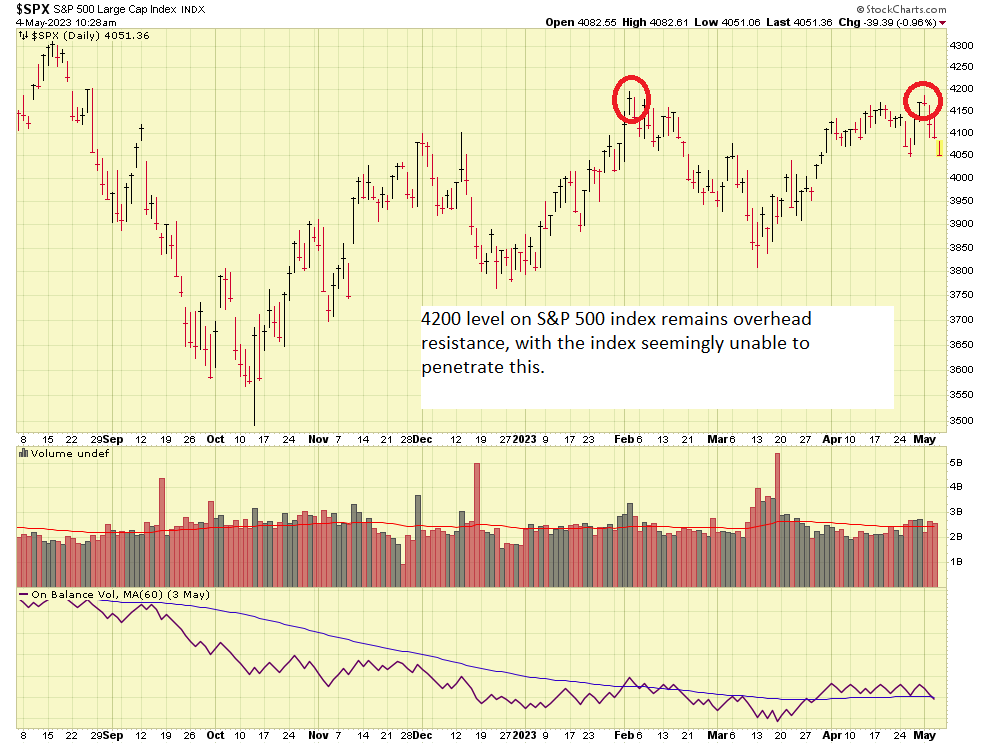
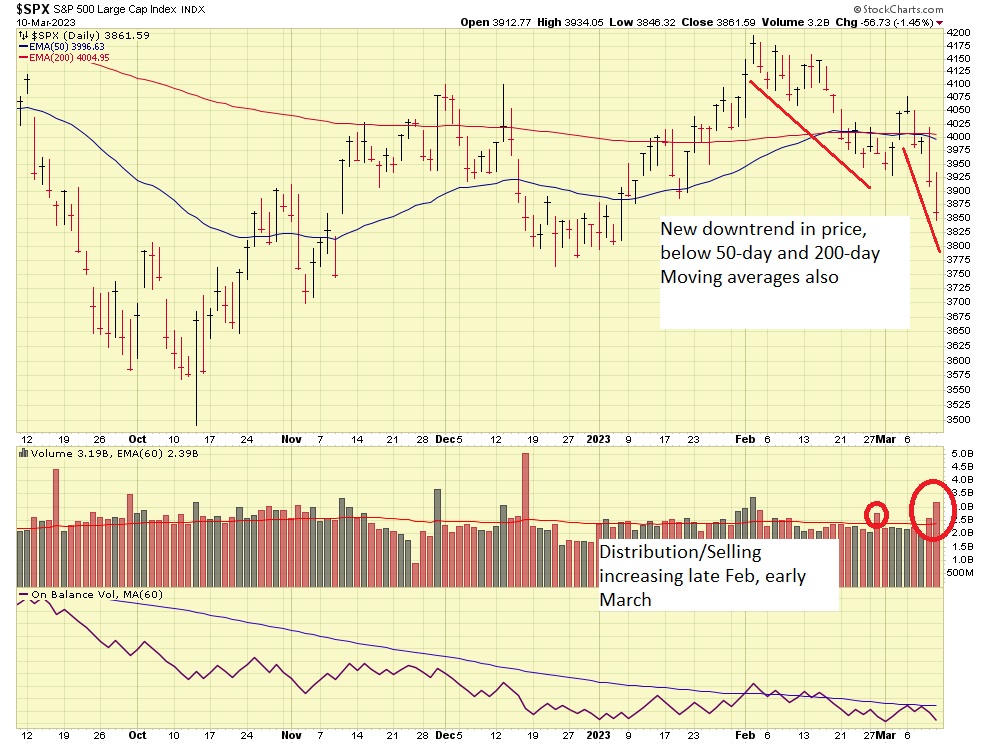
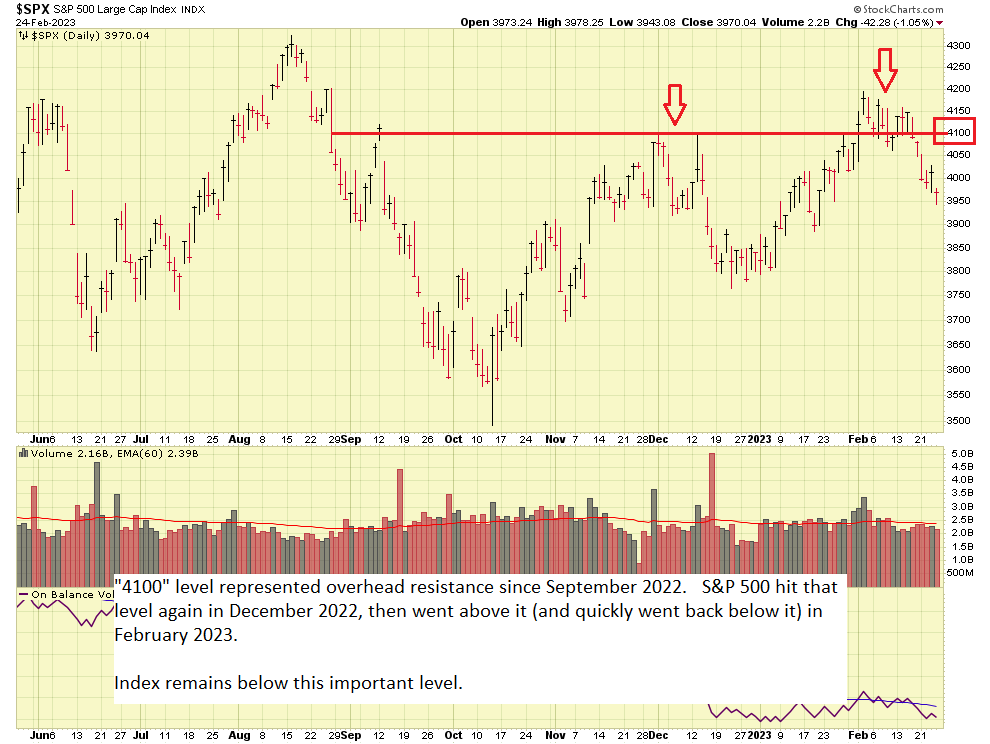
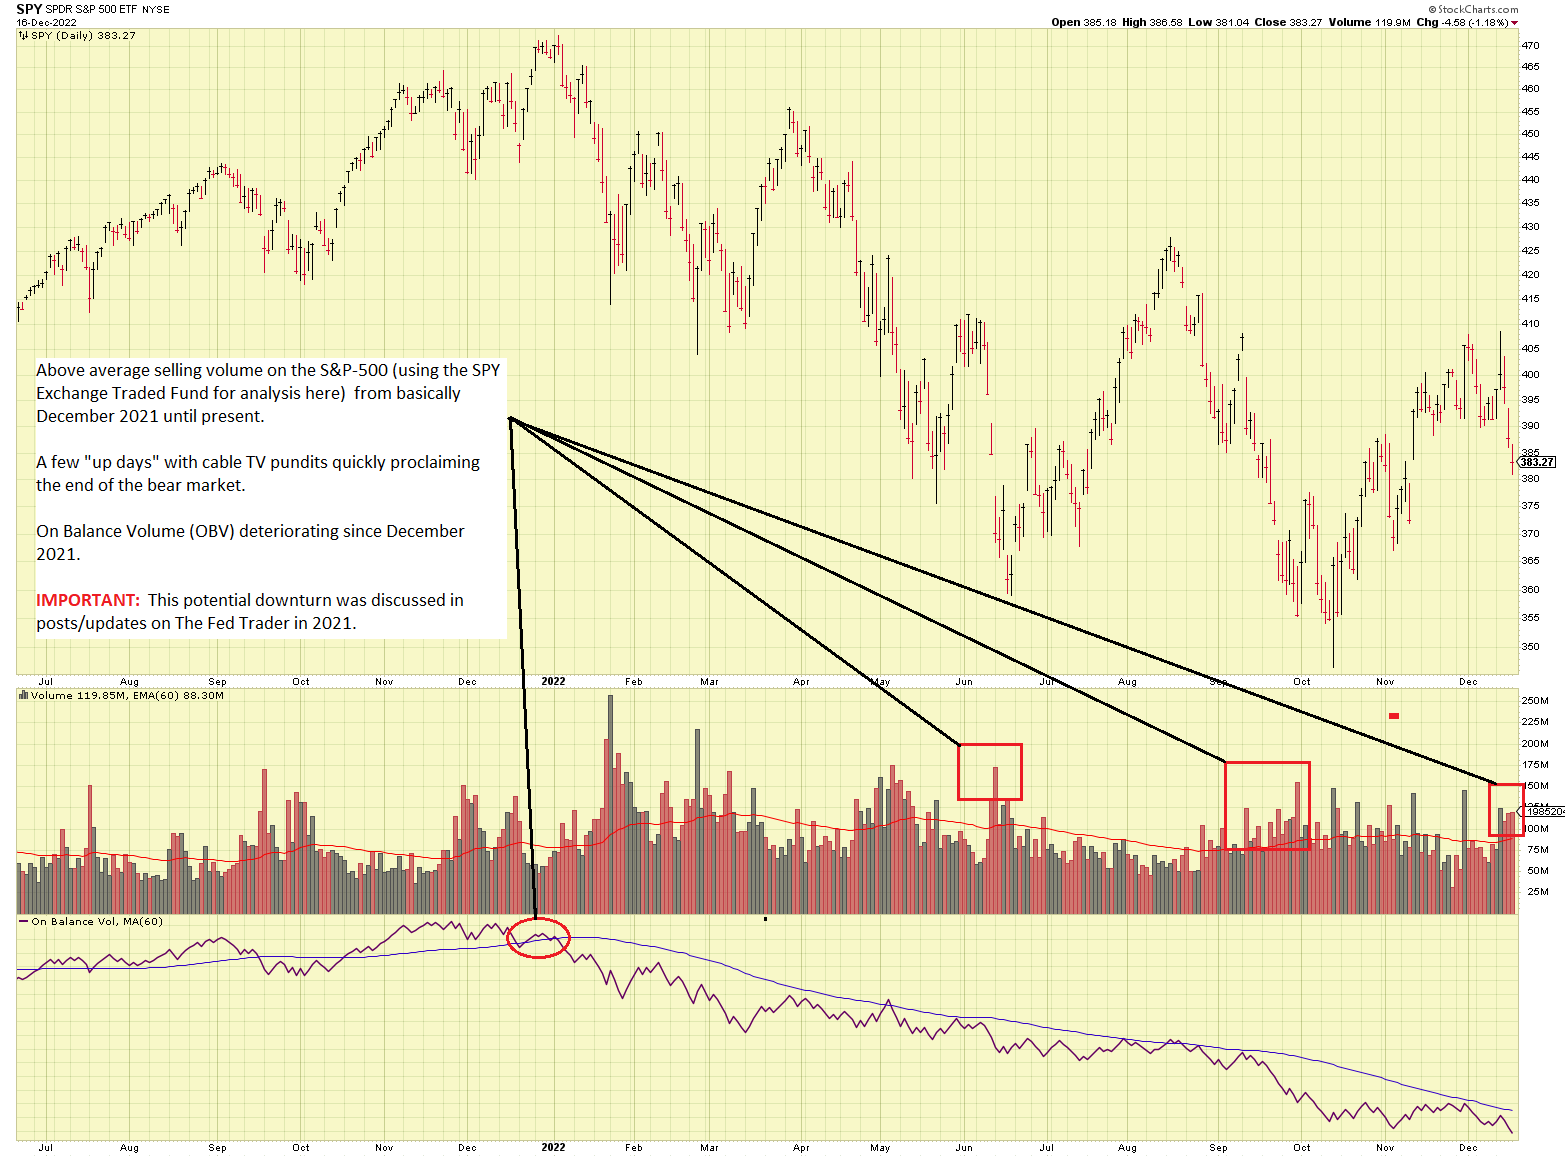
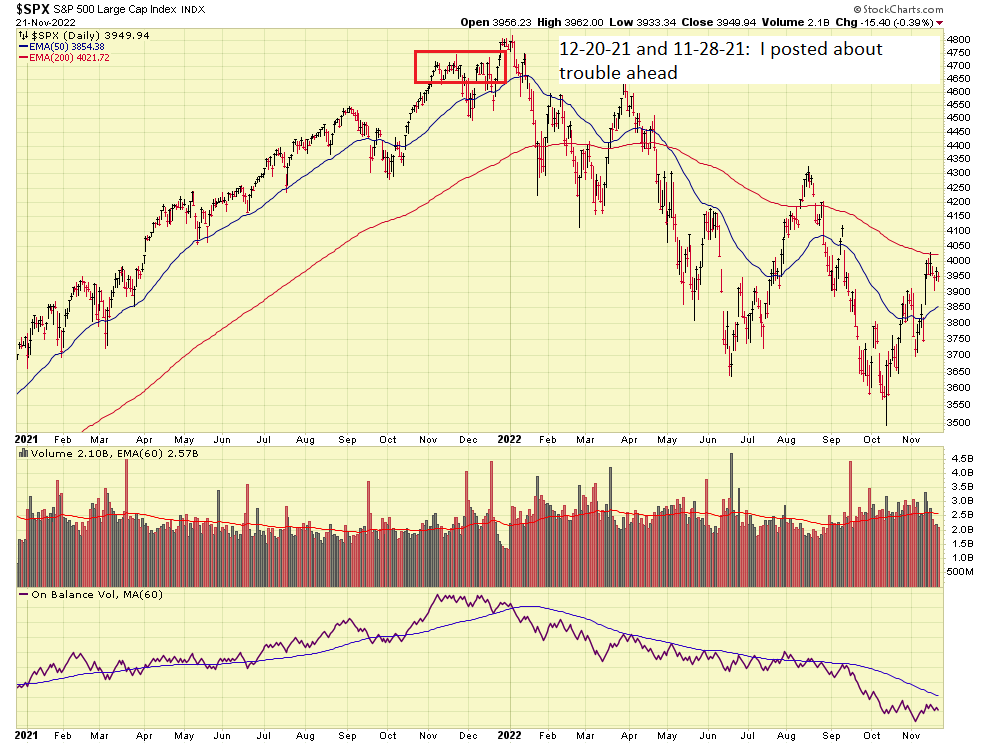
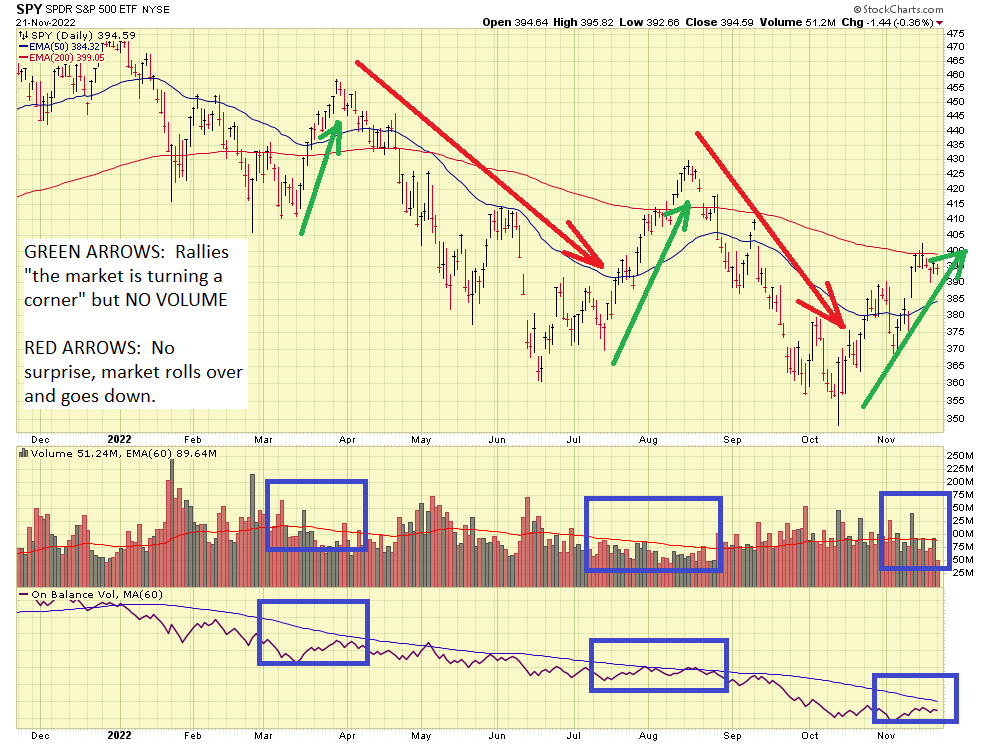
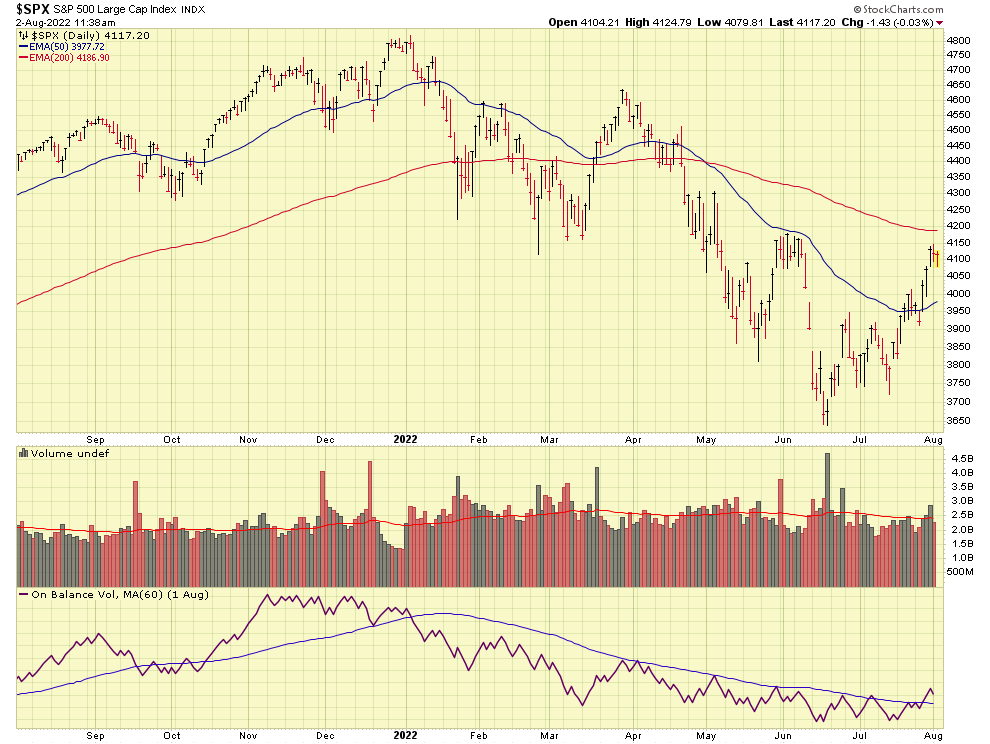
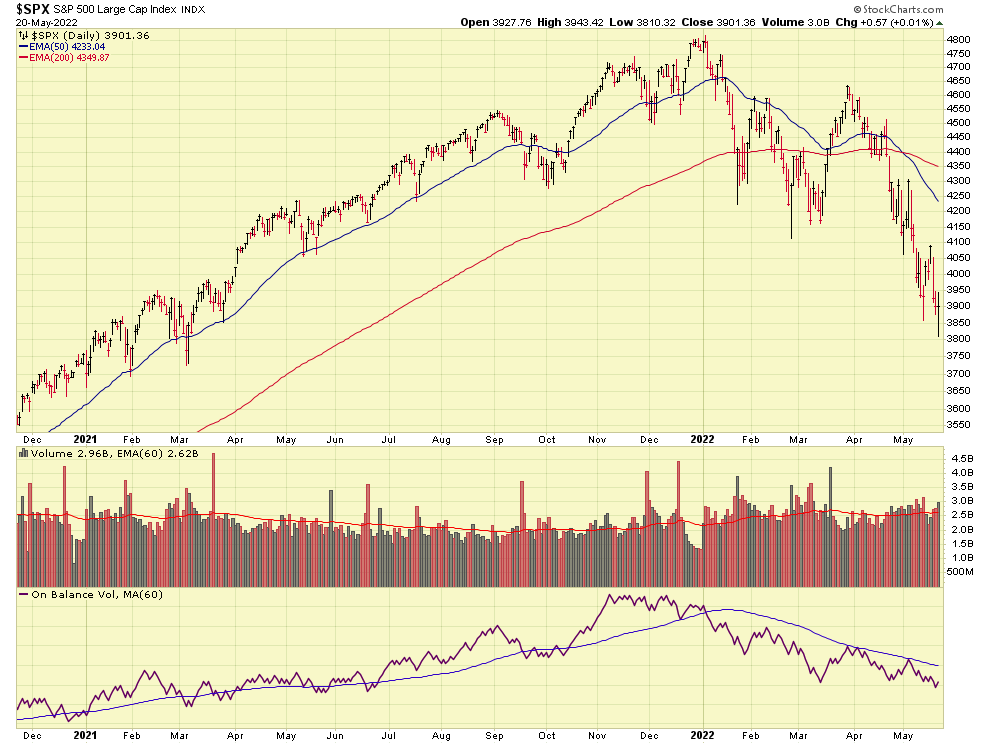
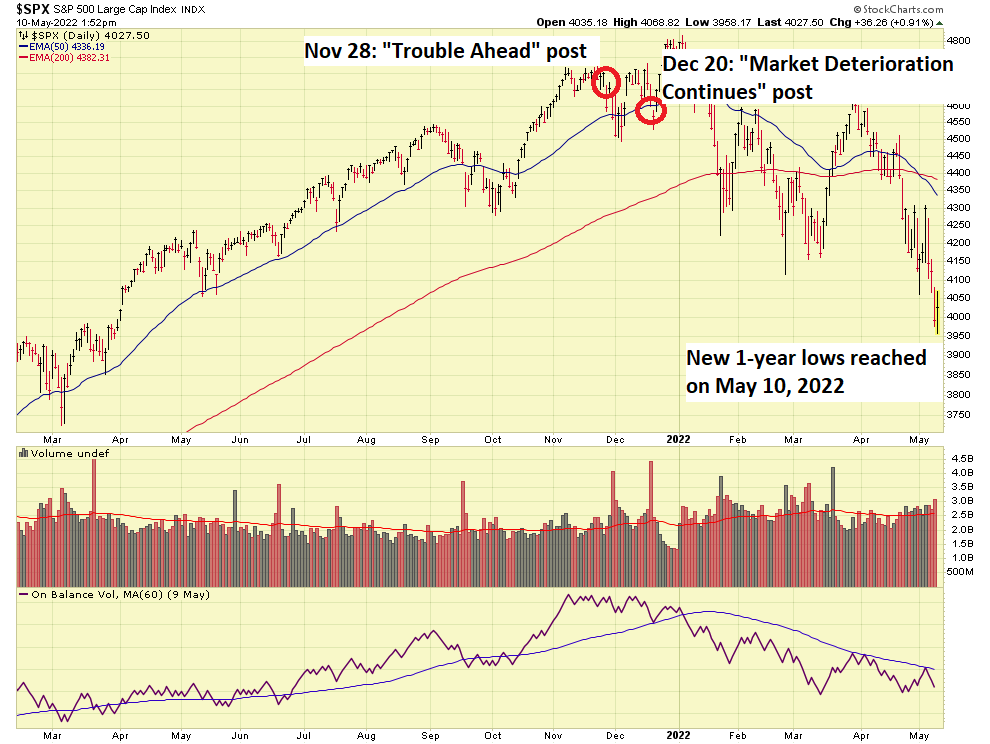
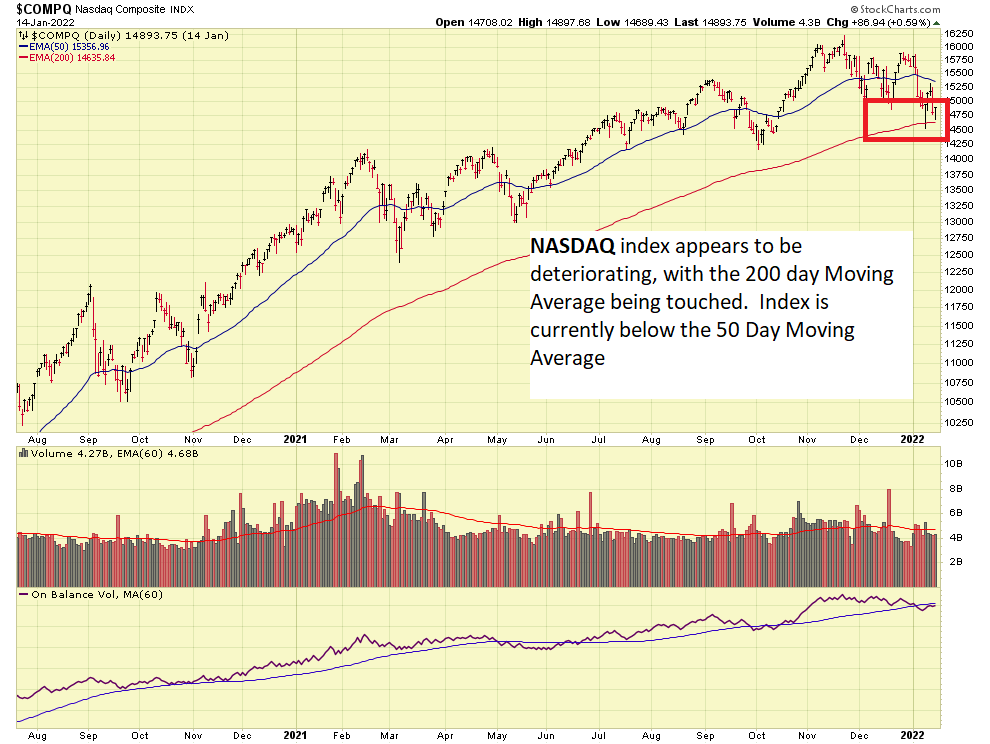
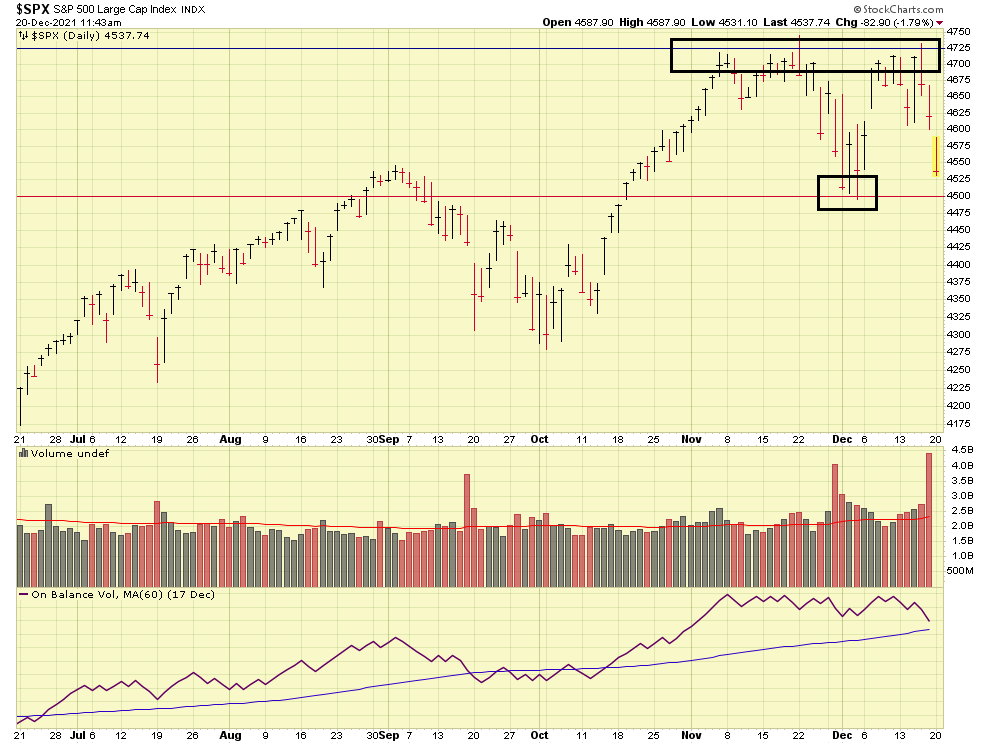
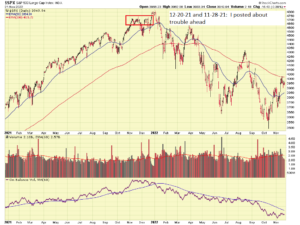
Bull market favorite S-Fund, is negative -24%. So if the G-Fund, with 4% return, is not keeping up with inflation (and it isn’t, hopefully the inflation problem is short-lived…), then I guarantee you that a fund with negative 24% return is not either. Lets take a look at the present chart of the S&P 500, I have annotated with red boxes the general time frame when I began to post about potential market trouble ahead:
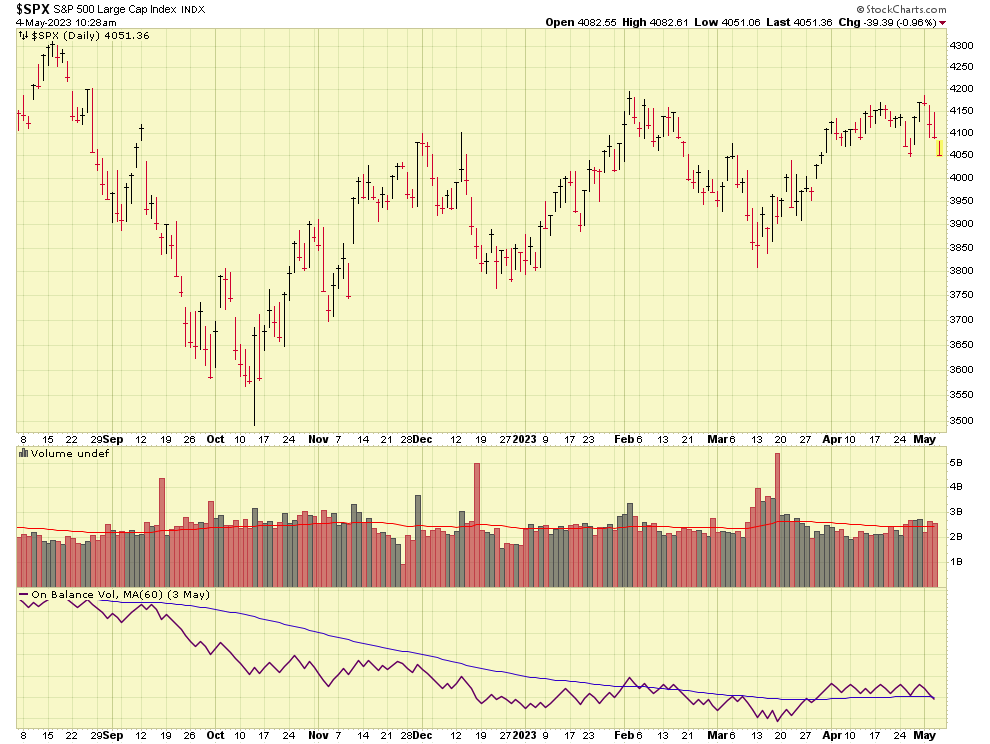
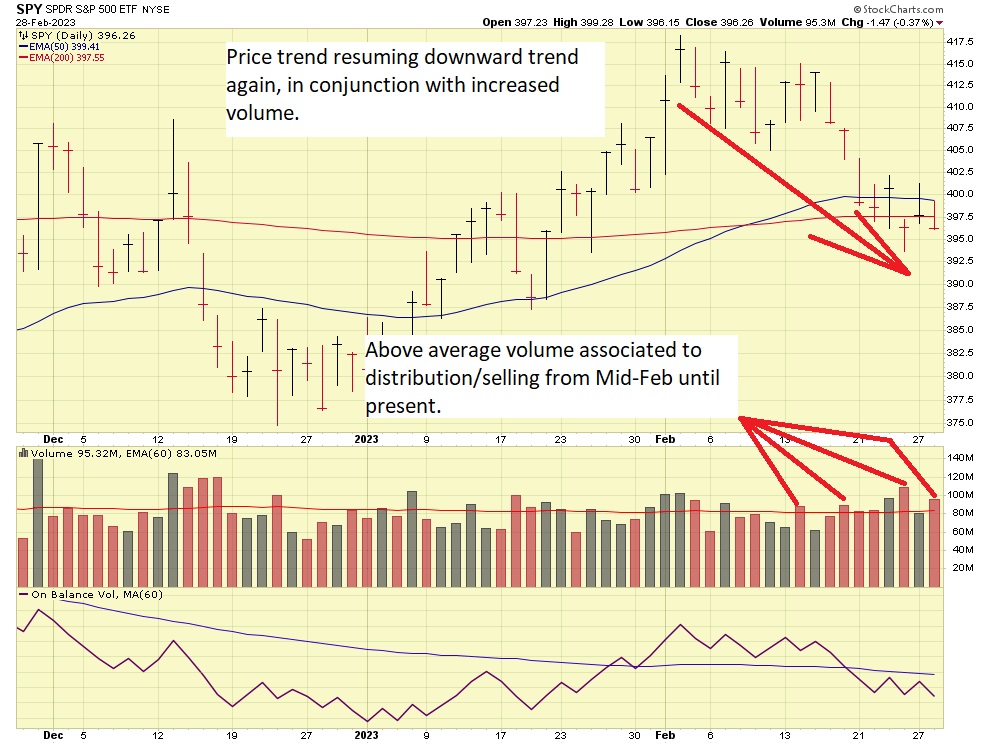
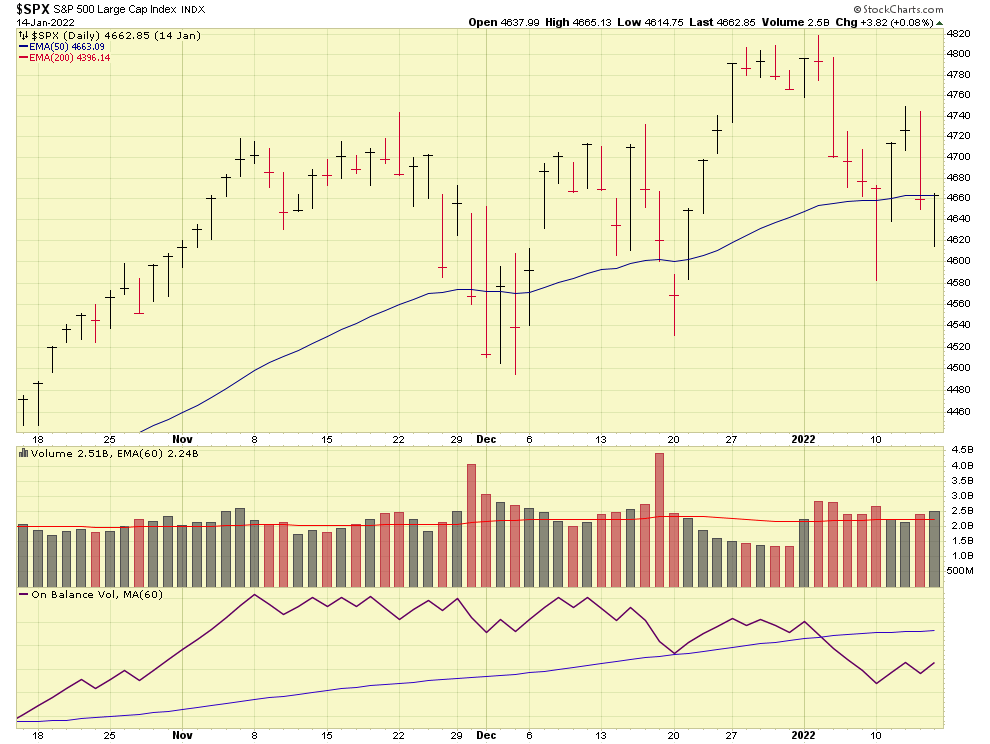
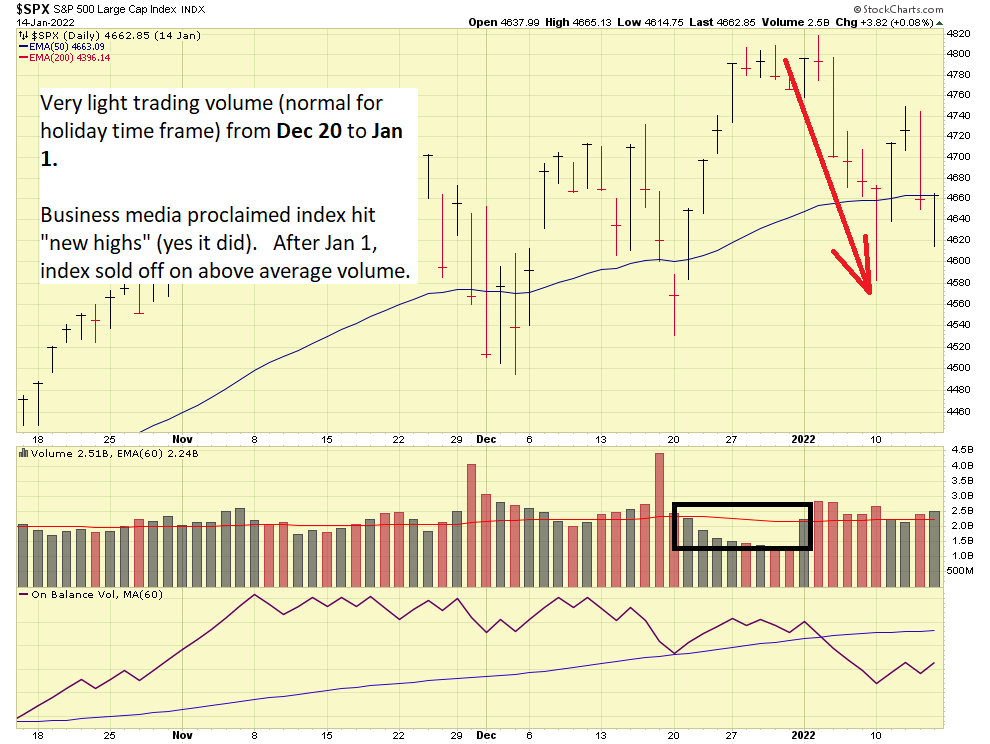
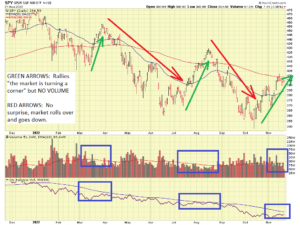
One indicator or metric that you have heard me mention many times is “Volume” or “Volume analysis.” Basically, a stock or index moving up or down is noteworthy, but if there is no volume “behind the move”, the move is likely to die or reverse, or simply not sustain itself. We have seen this numerous times this last 12 to 18 months. On the other hand, when volume is very powerful, with the market going up (or down), then that is much more credible for that corresponding movement. Typically this represents traders and institutional money managers all “agreeing” that XYZ should be sold or bought.
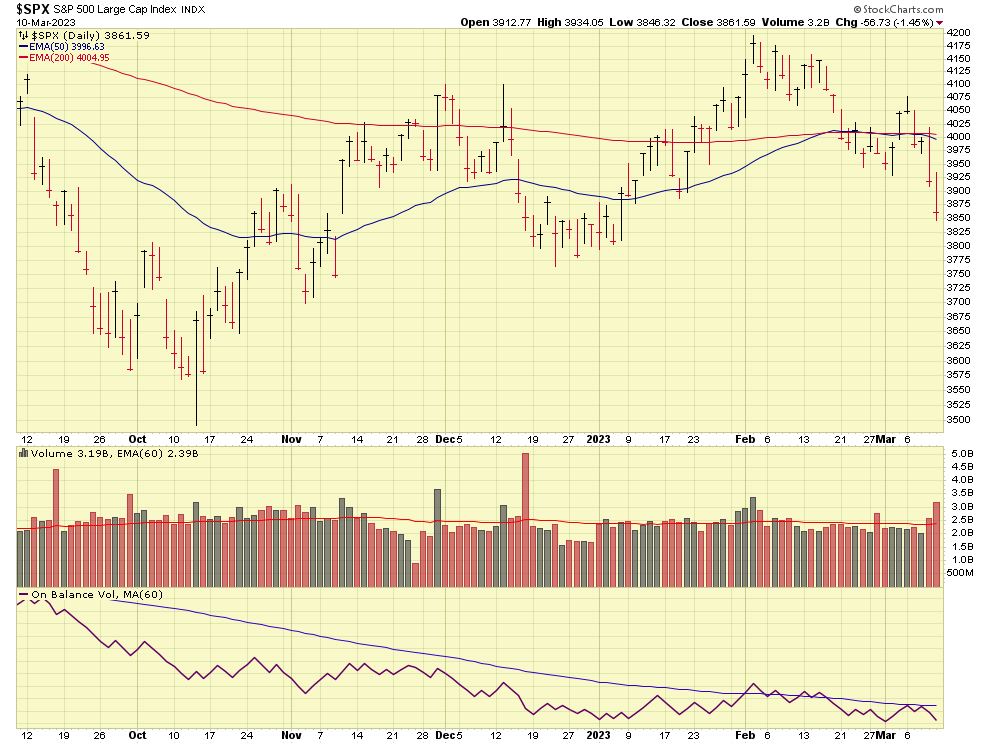
With that said, I personally am not seeing any volume on the rallying/uptrends that tells me things have changed. Not surprisingly, all recent rallies have died and resumed a downward trend. See chart:
Sometimes I get some “fan mail” that tell me I get carried away with too many charts or technical terms, I apologize if I geek out, but the information is there if you wish to look at it.
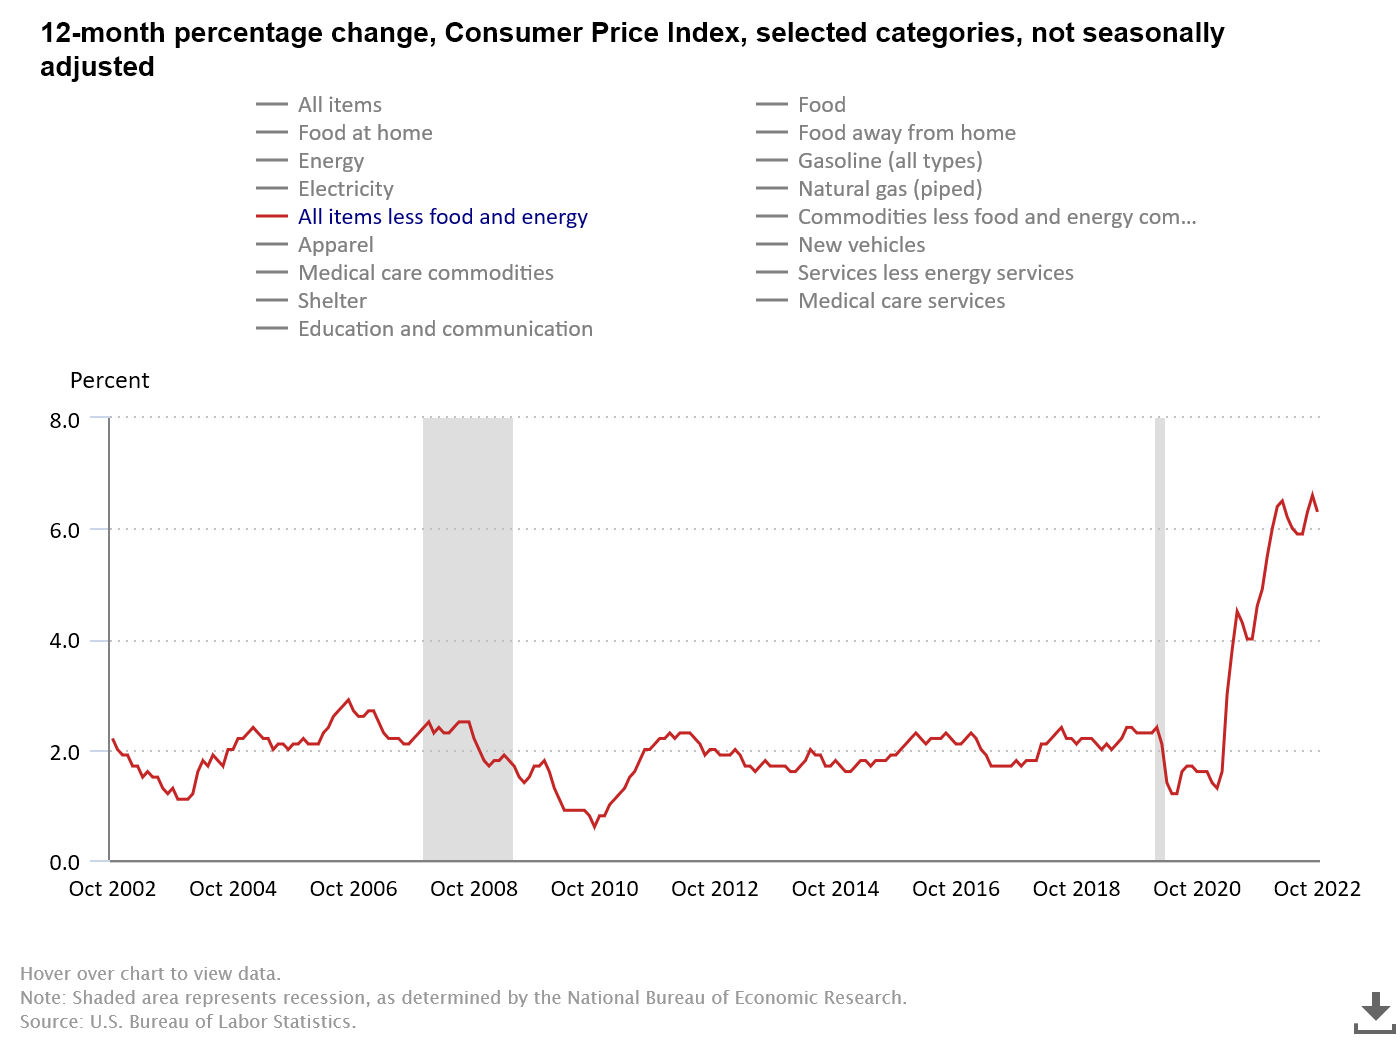
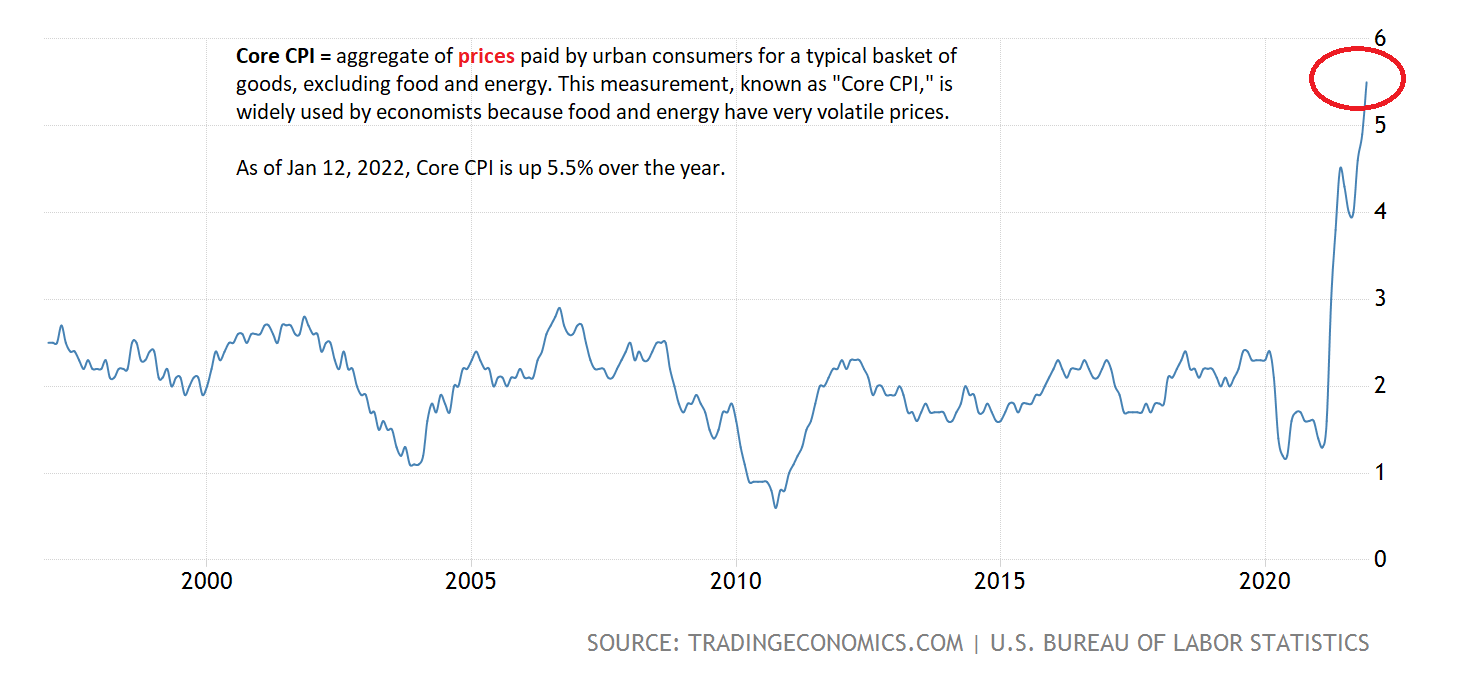
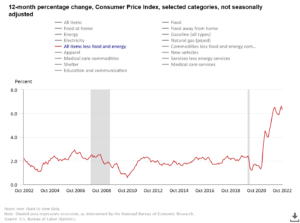
Challenges that continue to face the markets include inflation, interest rates (designed to curb inflation), and ongoing supply chain concerns. CPI inflation reportedly “cooled” (got better) but that is akin to being shocked by 500 volts to now being shocked by 400 volts. CPI inflation, minus food and energy, is 6.3% versus 6.6% in August 2022:
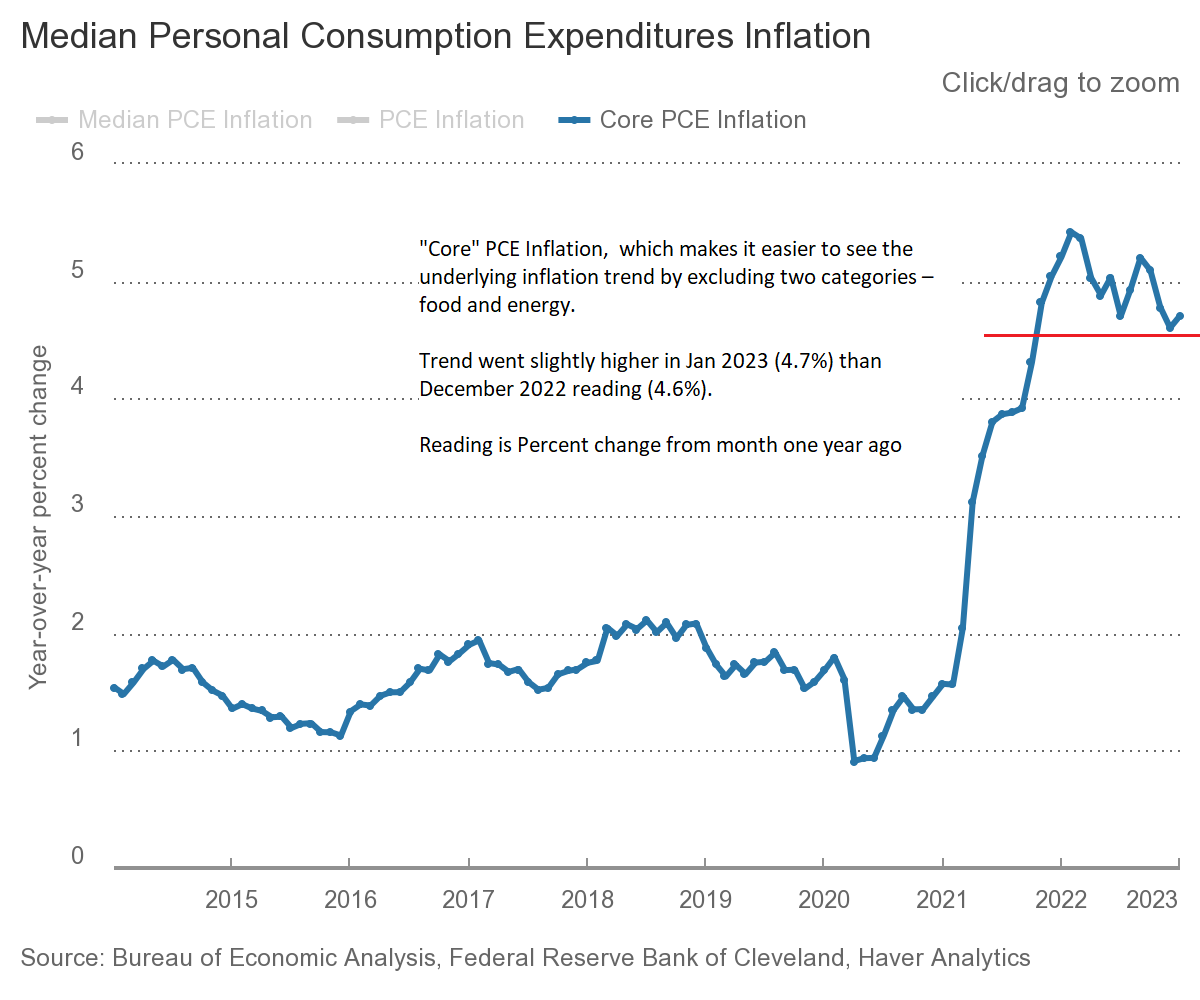
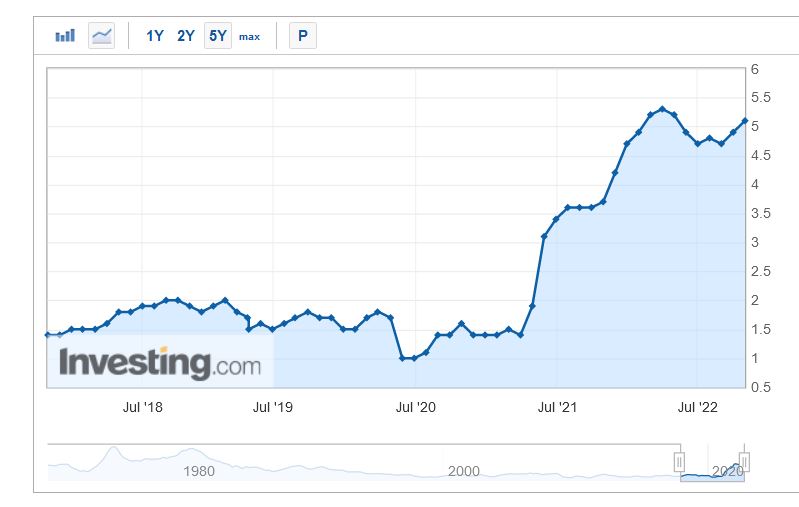
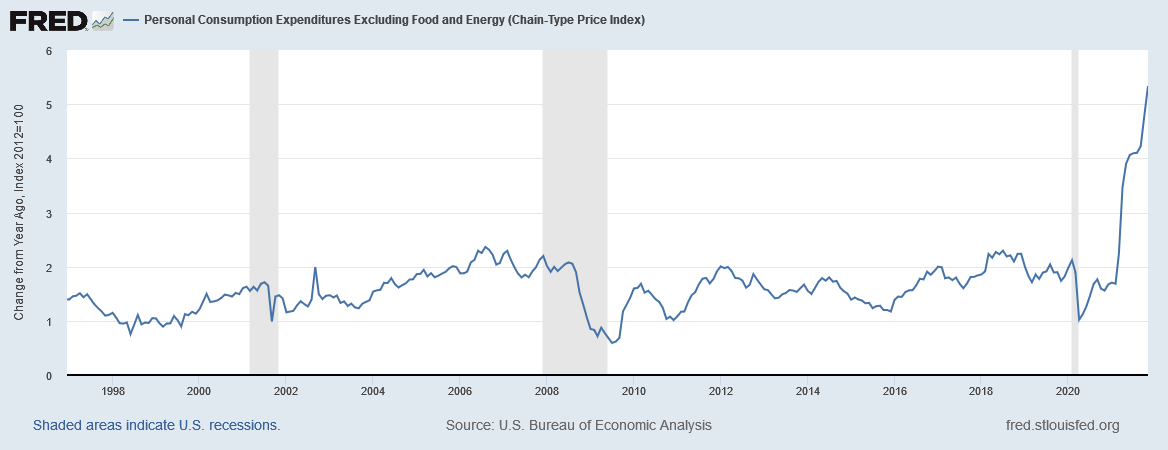
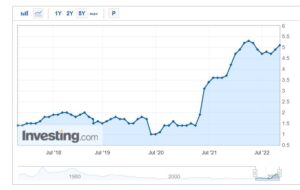
PCE inflation data, which is more closely watched by the FOMC, has come down slightly from earlier this year, but is still “high” by all accounts. Core PCE chart below:
In sum: Inflation is still a concern and this is not going away anytime soon. For more reading on CPI versus PCE metrics, please go to this 2015 Wall Street Journal article here.
Upcoming inflation report dates, if you are interested:
PCE: Next release on December 1, 2022
CPI: Next release on December 13, 2022
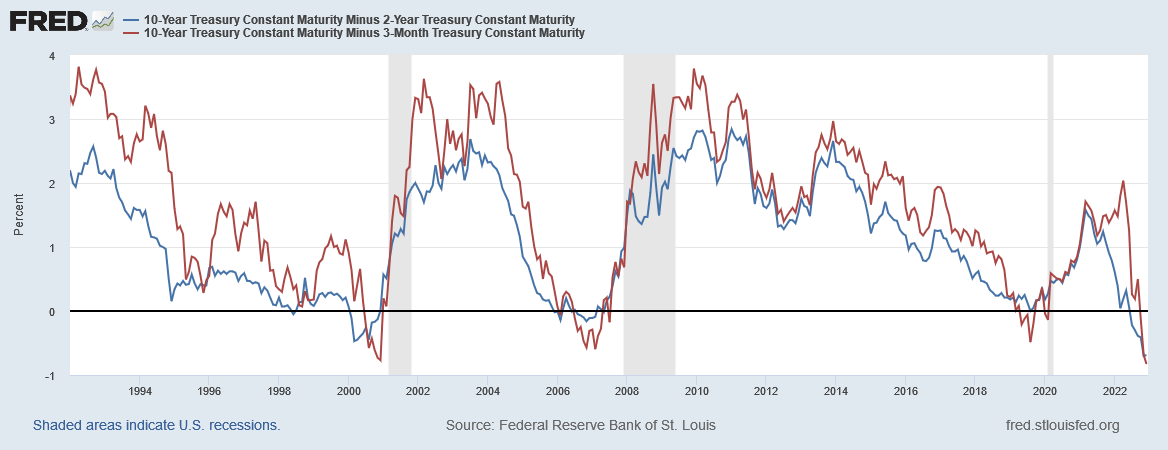
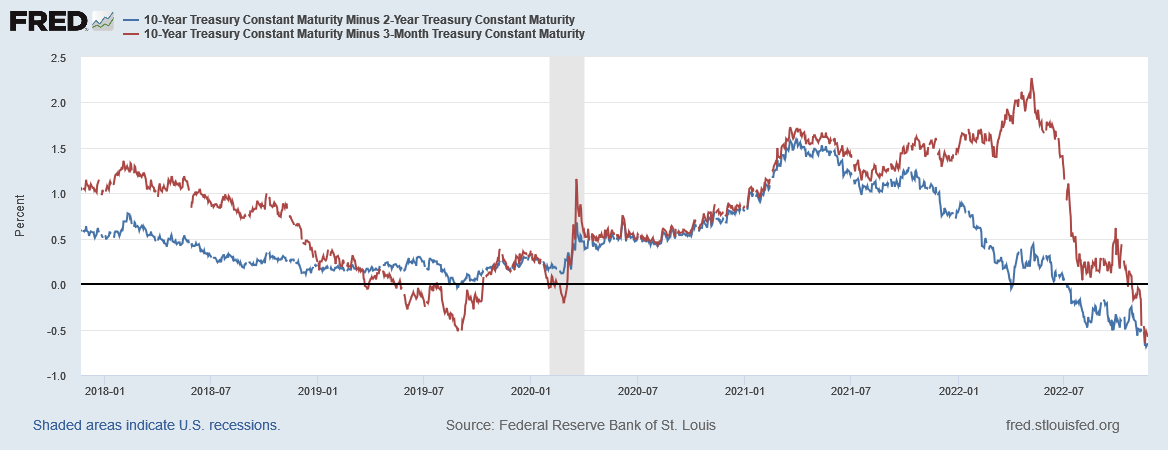
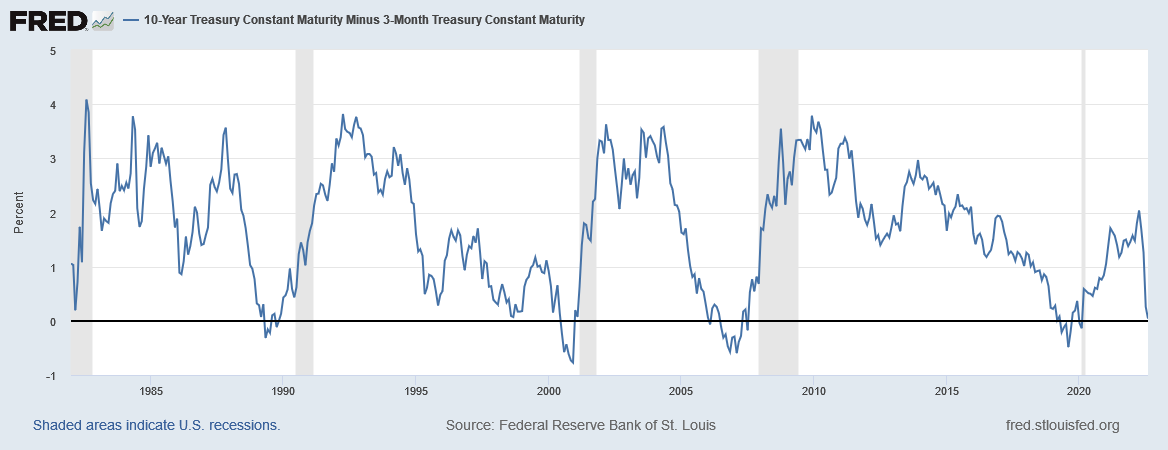
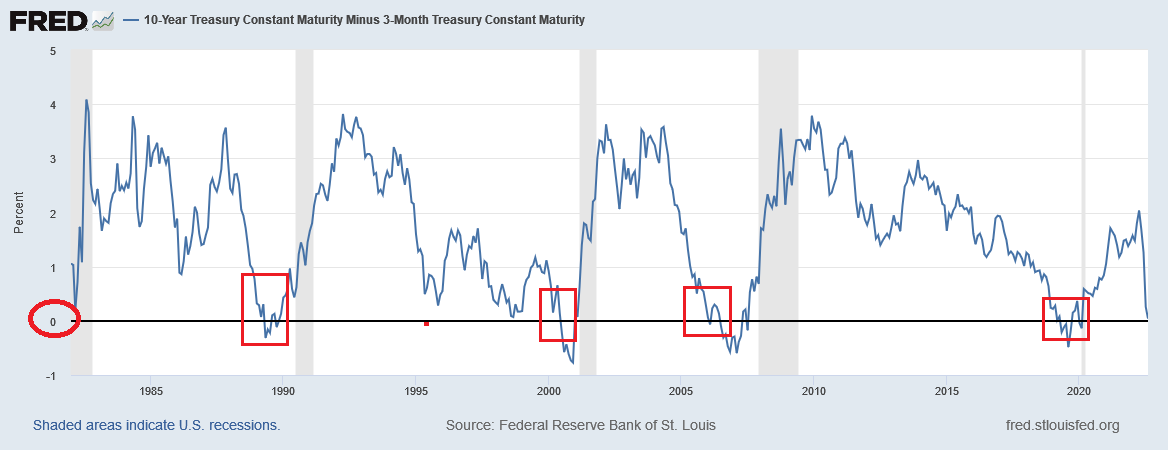
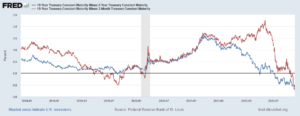
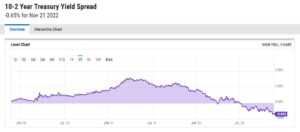
Some of these aforementioned challenges have caused the Yield Curve to “invert.” Long story short, an “inverted yield curve” is believed to be a predictor of a looming recession (personal opinion is we are already in one, but….). See chart of Yield Curve going “negative” below the”Zero Line:”
In summary, it is my opinion that numerous challenges lie ahead before a sustained, new, Bull market, can rise from the ashes. Once it does, I will be “in” with both feet. Until then, I am not chasing daily or weekly rallies. Only when I see a clear signal that sentiment has changed, will I make a move back into stock funds.
With that said, I ask that you participate in the poll below.
Thank you, and Happy Thanksgiving to everyone.
-Bill Pritchard
POLL: https://take.quiz-maker.com/poll4595721xC9dD40b9-144

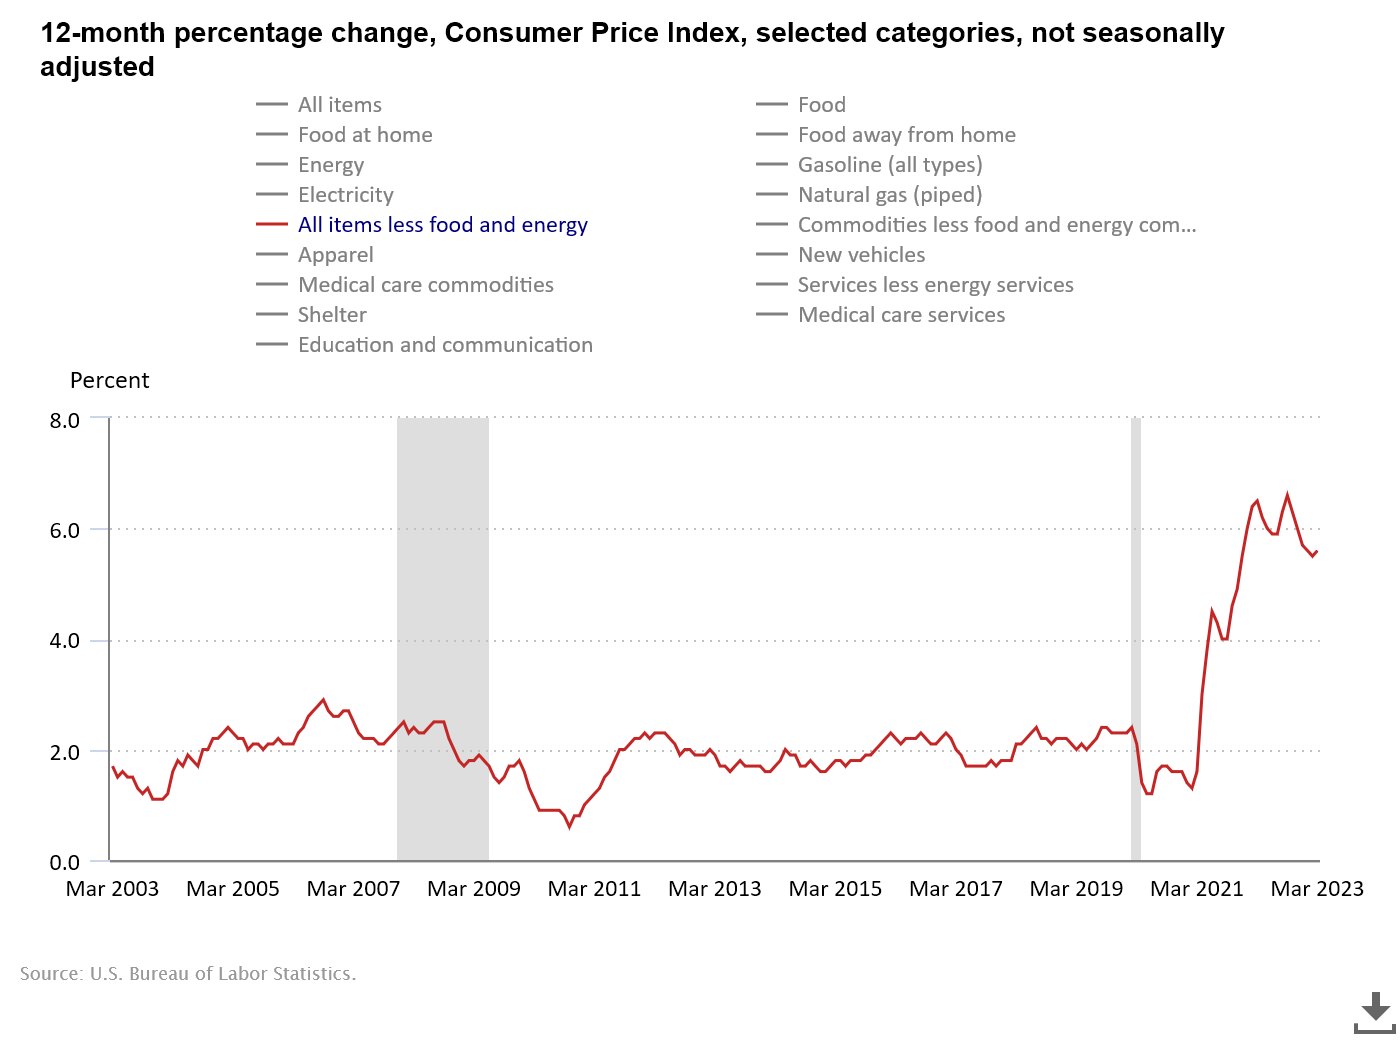 The most recent reading, for March 2023, came in (Core CPI, CPI minus fuel and food) at 5.6%. In the event the May 10, 2023 Core CPI number is not improved, the markets will continue to decline. (Any improvement will likely cause the markets to rally and thus serve as a possible foundation to finally change the trend of the markets).