
Hello Everybody
I remain 50% S-Fund and 50% C-Fund.
I wanted to go ahead and update things, as the markets have been seeing great performance since late October. This serves as another reminder that the TSP is not for “trading” but indeed, my opinion, and how I handle my own account, is I try to be aware of what economic changes and market forces exist that may tend to create the best chances of success for a particular fund. With that said, anyone who “threw in the towel” and went to the G-Fund after the very unfortunate Hamas attacks on Israel, on October 7, has missed quite a few positive days in the markets. This event, what I could call a “Black Swan”, is not something I personally change TSP allocations for.
Additionally, contrary to belief, inflation is ticking down, and the data supports that thesis. Average national gasoline prices are back down to 2012 levels. See chart:
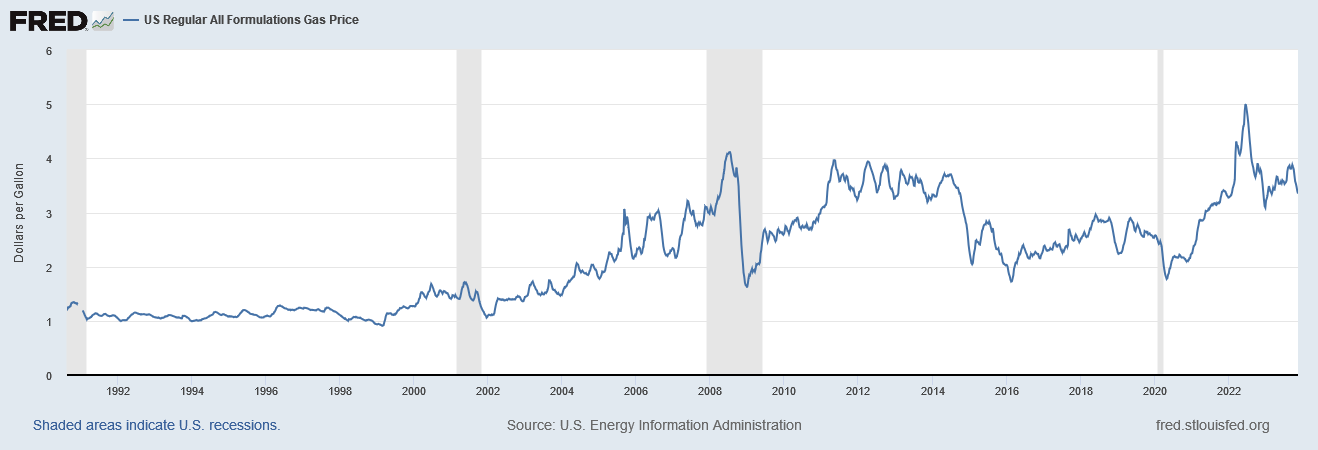
This should serve the travel industry favorably: Lower fuel prices encourage budget conscious travelers to travel, which then helps hotels sell rooms. Airlines also of course benefit from lower fuel: this holiday travel season is reported to be the biggest in many years.
“Core CPI”, which is inflation data without food or fuel, is down also. Again, this is cold hard data and hard to refute. See chart:
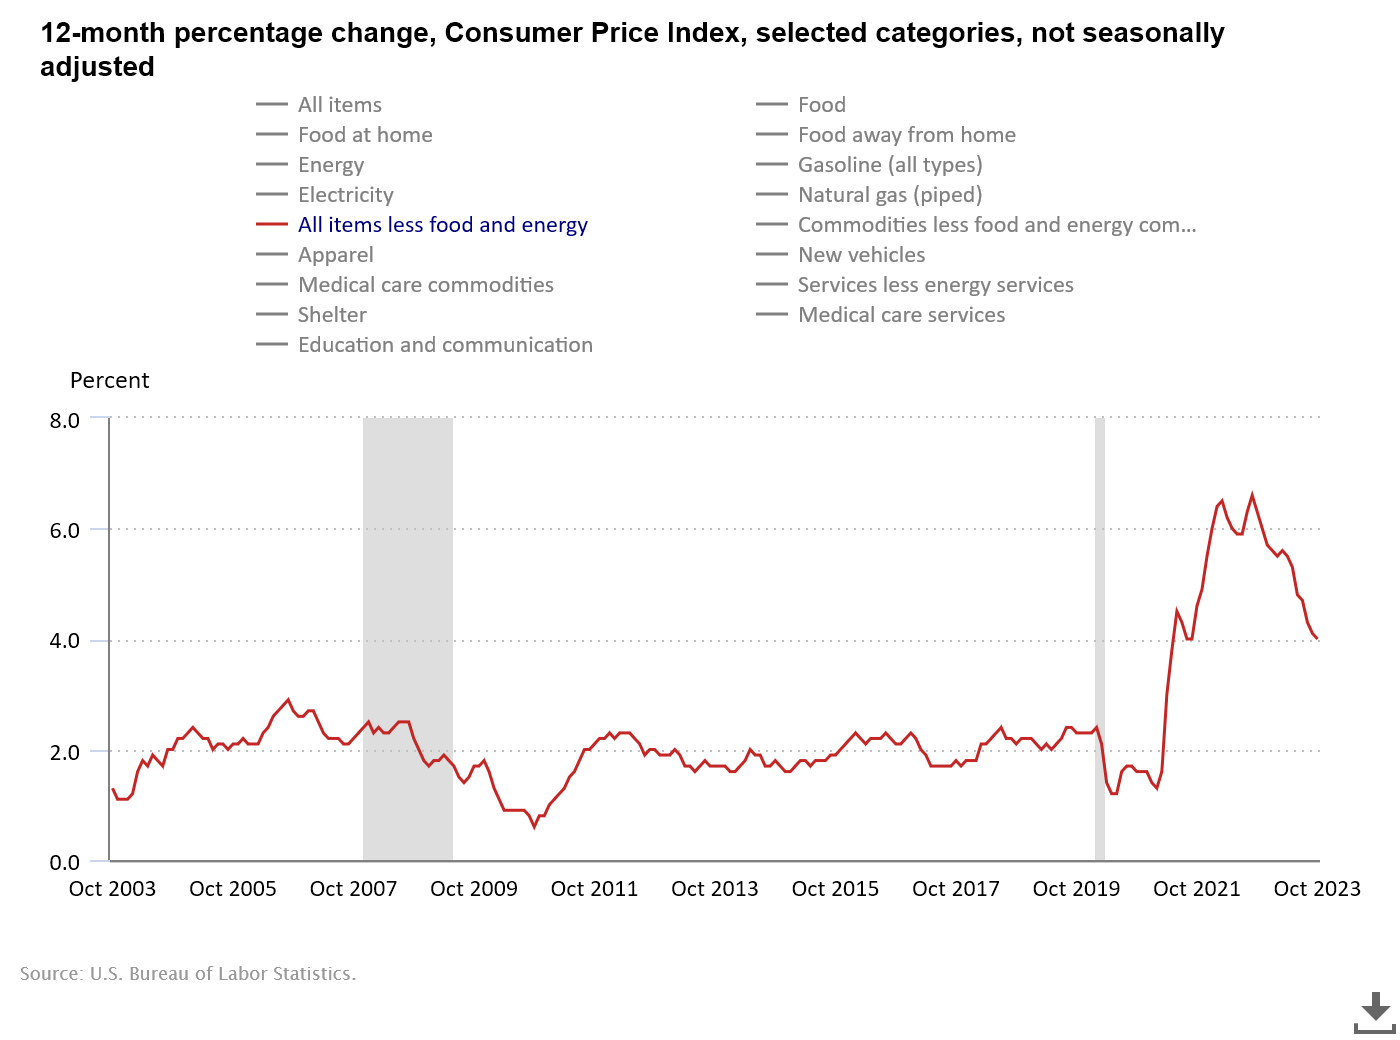 “It is not at 2020 levels (1.2%)” Of course not. In 2020 the entire planet was shut down due to COVID, and nobody was out consuming or spending much. When things opened back up, a sudden demand-spike on existing stockpiles hit, all at the same time. 2020 is nobody’s “fault” but from an economic standpoint, we cannot compare today’s environment to 2020. The FOMC wants to drive inflation back down to 2% which is a normalized and accepted level. So far, with inflation in a downtrend, the sentiment on Wall Street is that further interest rate hikes are paused or even cancelled.
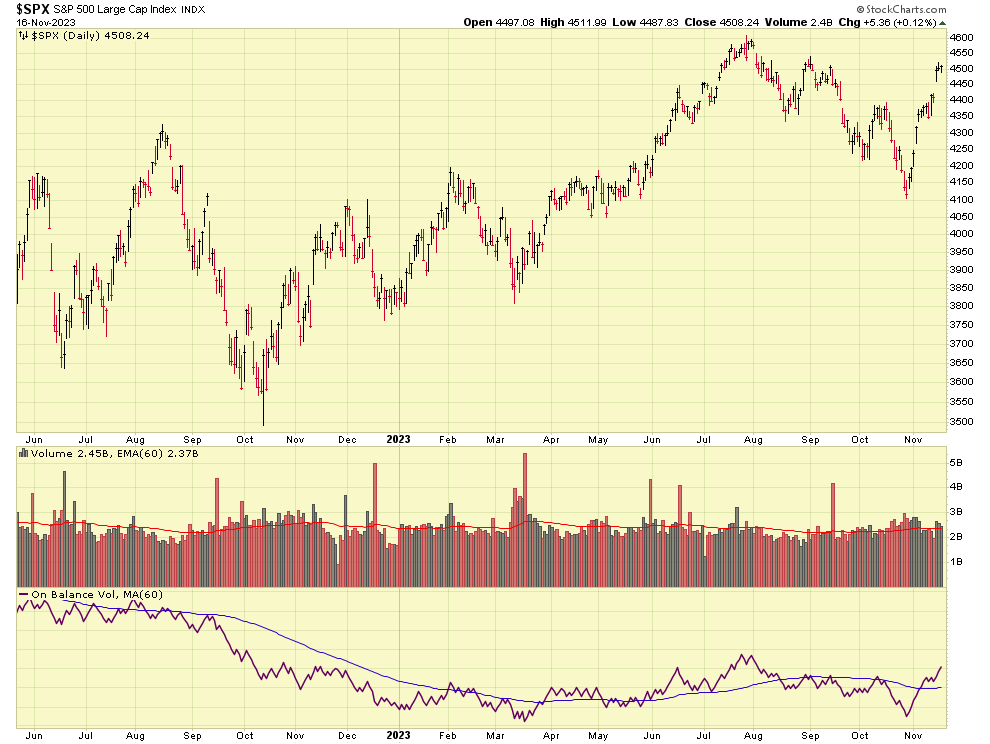
Lets take a look at the final, and most important, barometer of all, the market itself. I use the S&P 500 as my benchmark index. Lets look at a 1.5 year chart, then a 3-month chart, then a 3-month chart with my annotations made to it.
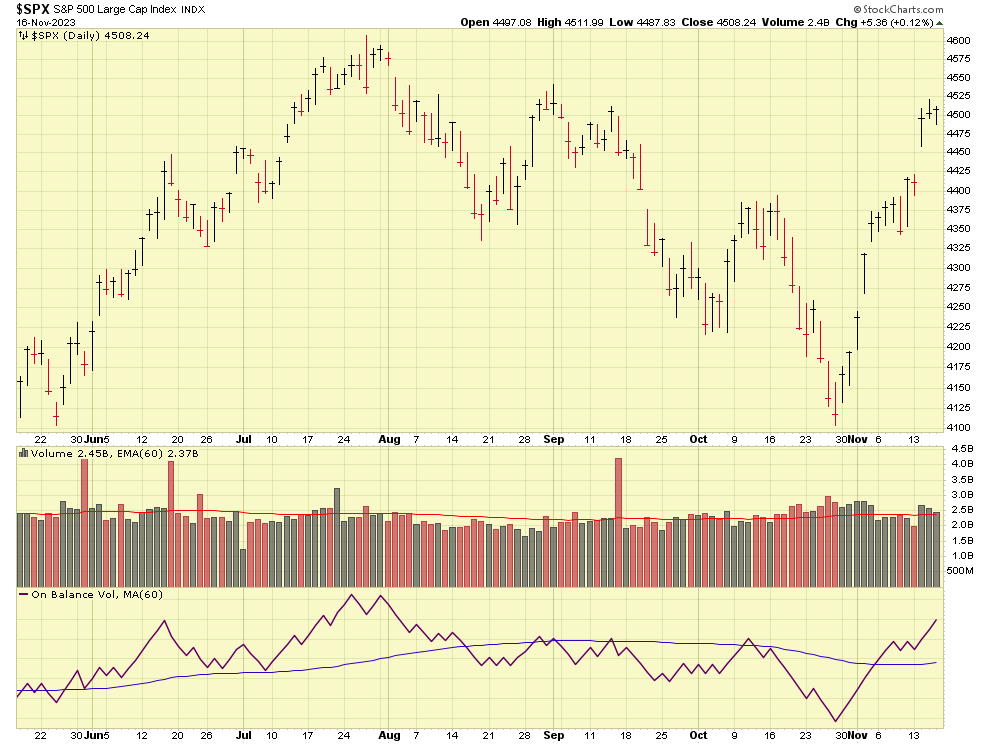
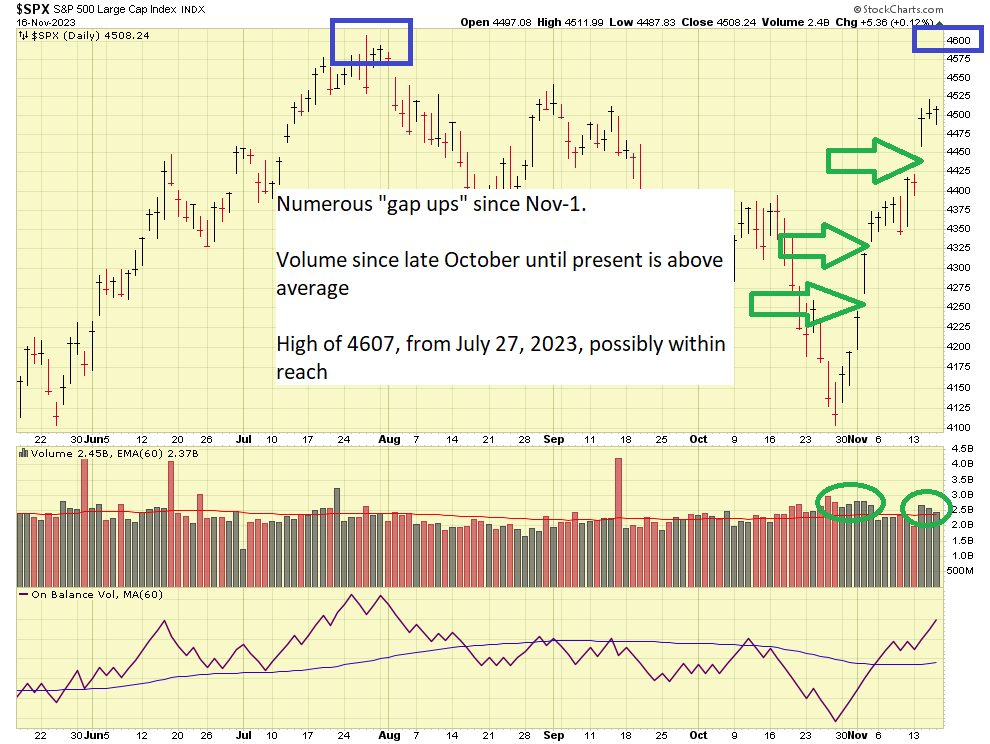
As can be seen, the index has seen numerous “Gap Up” days, indicating strength and bullishness. Also note that accumulation or money inflows, by major institutions, is likely underway, reflected by the above average volume starting in late October. The 52-week high, 4607, attained July 27, 2023, is possibly “within reach” as the index currently sits at the 4500 level. 4550 is the next hurdle, then 4600.
For the above reasons, I feel very confident in my current TSP allocation of 50% C-Fund and 50% S-Fund.
Thank you for reading and I hope everyone has a great Thanksgiving holiday.
If the graphics in this post do not appear (likely due to email systems blocking images or HTML), please click on this link and just read the post from the website itself: https://www.thefedtrader.com/
Thank you again
-Bill Pritchard
