
Hello folks and Happy (belated) New Year
Bottom Line Up Front: I remain 50% S-Fund, and 50% C-Fund, a position I have held since June 2023. This is my personal TSP allocation- let’s talk about my view of the markets and my thought process behind my own personal TSP decisions.
Note: If the graphics/images in this post to do make it past your email spam filters, please proceed directly to the website itself to view this update. Link: https://www.thefedtrader.com/
2024 is off to quite the start. Not sure how you feel but I can’t believe it is already time to take down the Christmas tree and keep those HOA letters at bay, those Christmas lights must come down. The markets apparently feel the same way, it wasted no time to put December in the past. By mid-January, it had reached new highs and demonstrated impressive gains. Let me share some personal opinion regarding what I see happening…
Stock Market:
The S&P 500 recently hit a new 52-week high, on January 19, 2024, reaching 4842.07. A closer look reveals that the market has recently gone higher than it has been in over 20 years. The NASDAQ, primarily tech companies and smaller capitalization companies (S-Fund members) hit a new two-year high. Lets take a look at some charts:
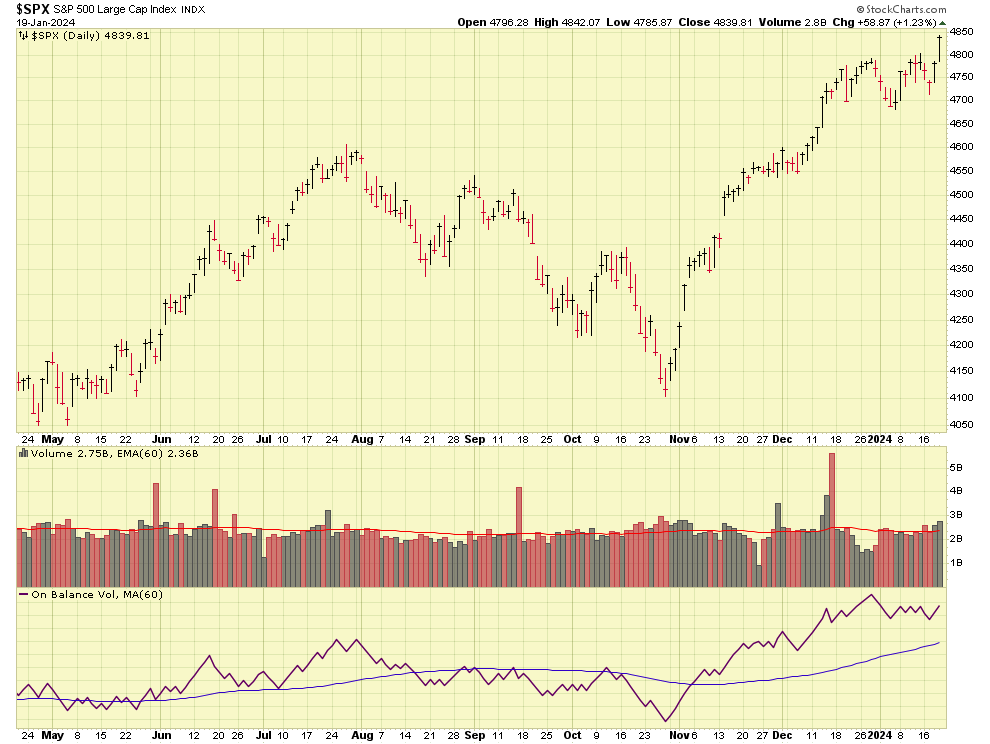
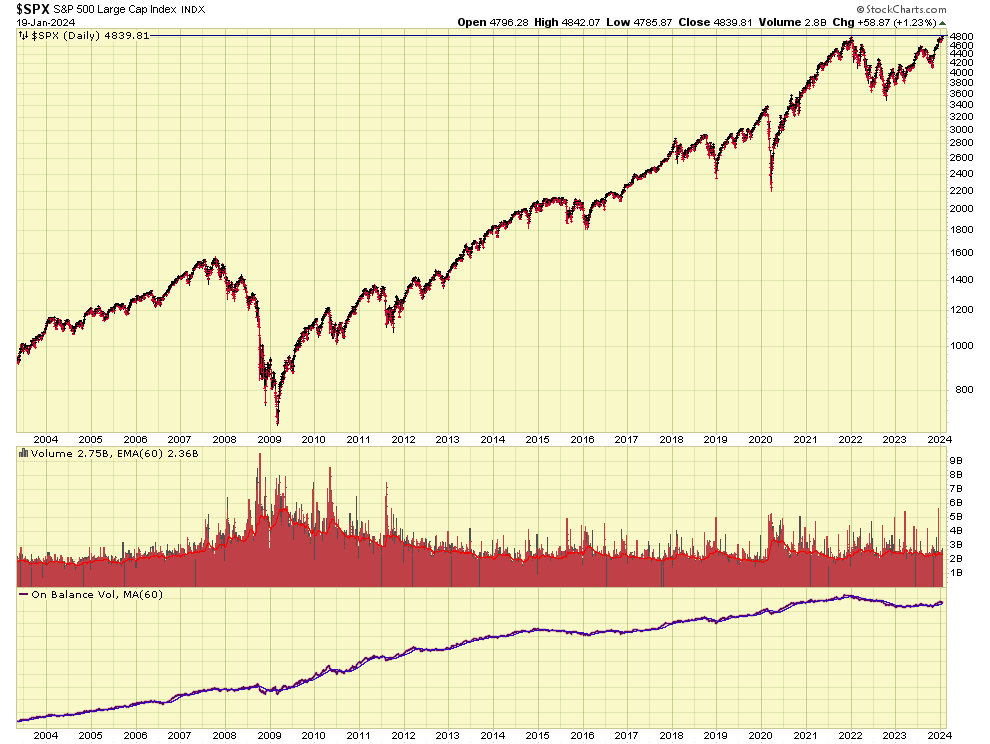
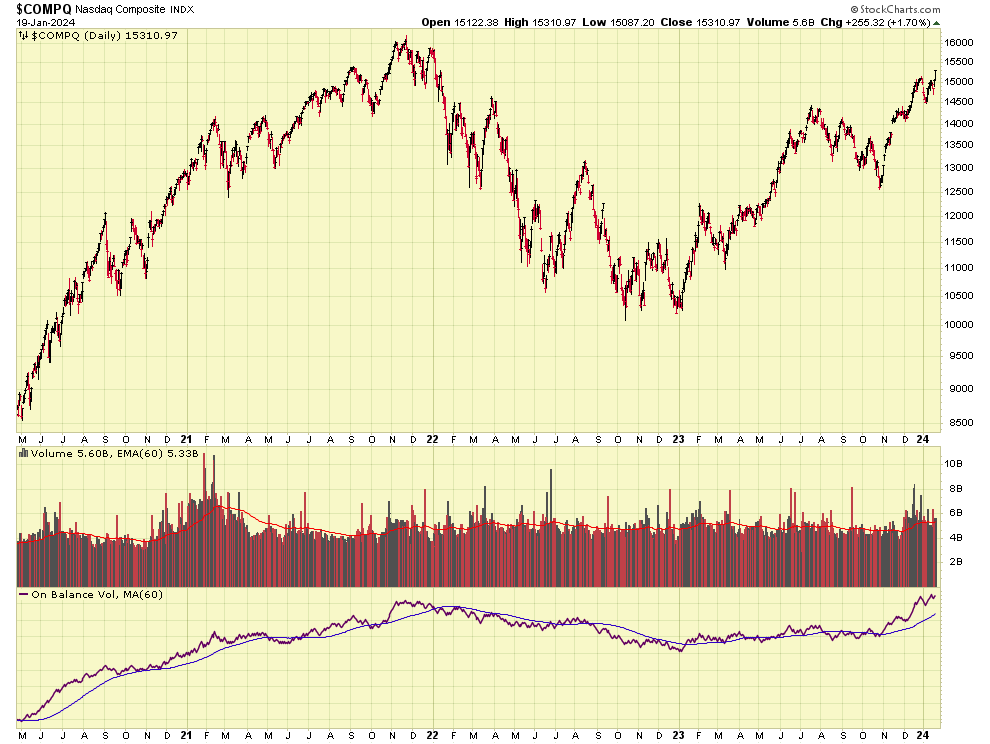
Apparent in the charts is the strong price action, and volume action, in both indexes. Apparently the institutional money feels good about the investing climate right now.
Inflation:
Both Core CPI, and Core PCE inflation data (the definition of which has been discussed numerous times on this site) reflect a downward trajectory for inflation:
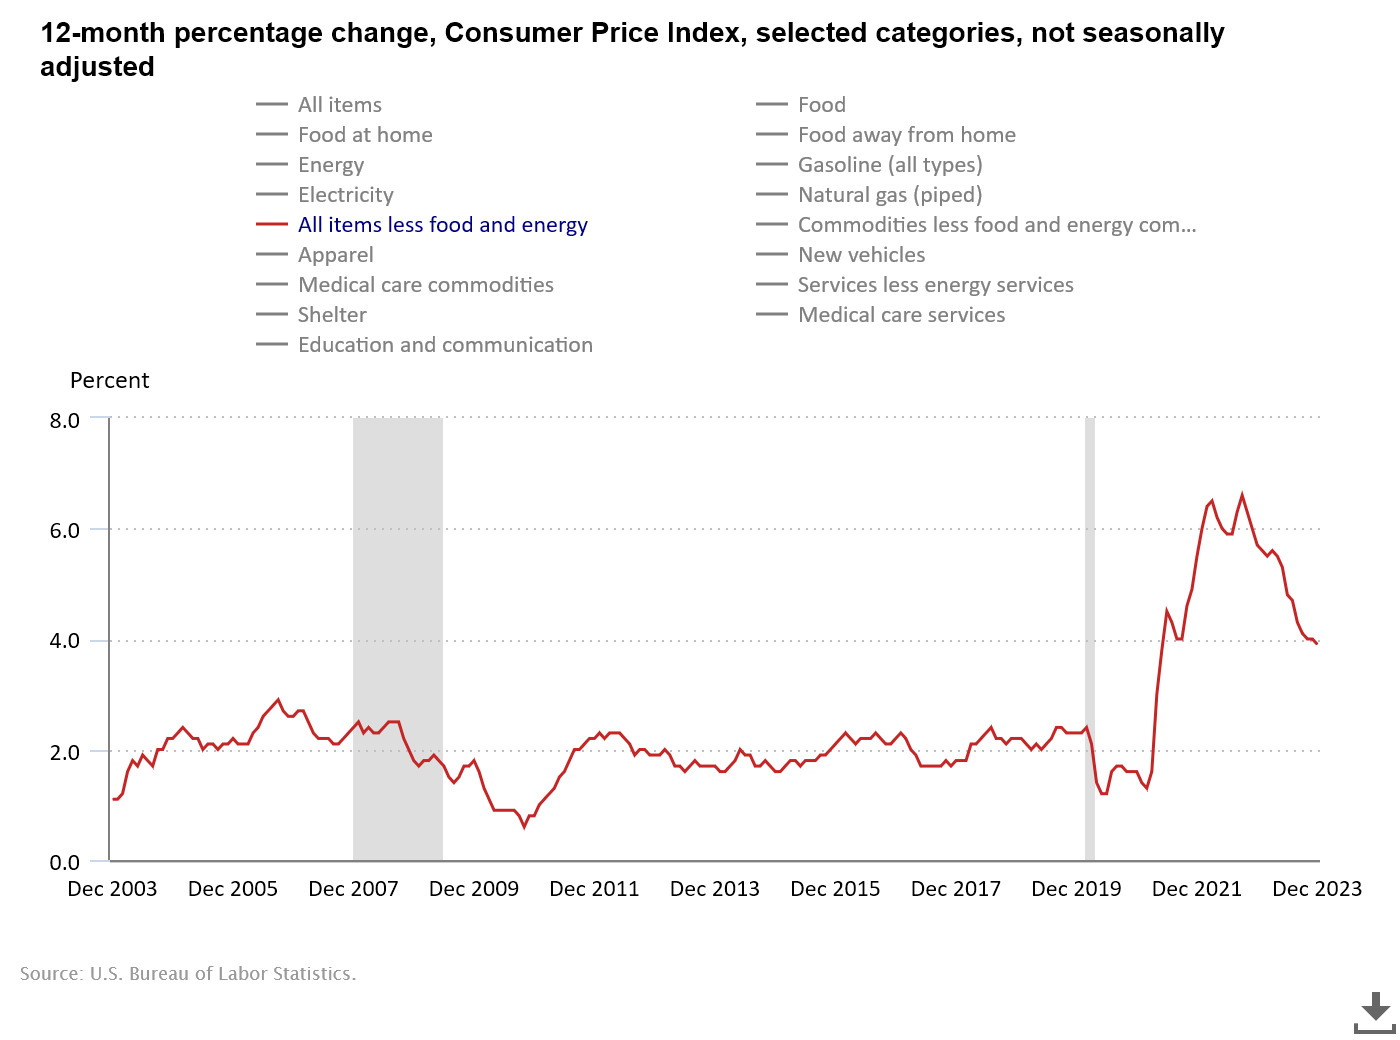
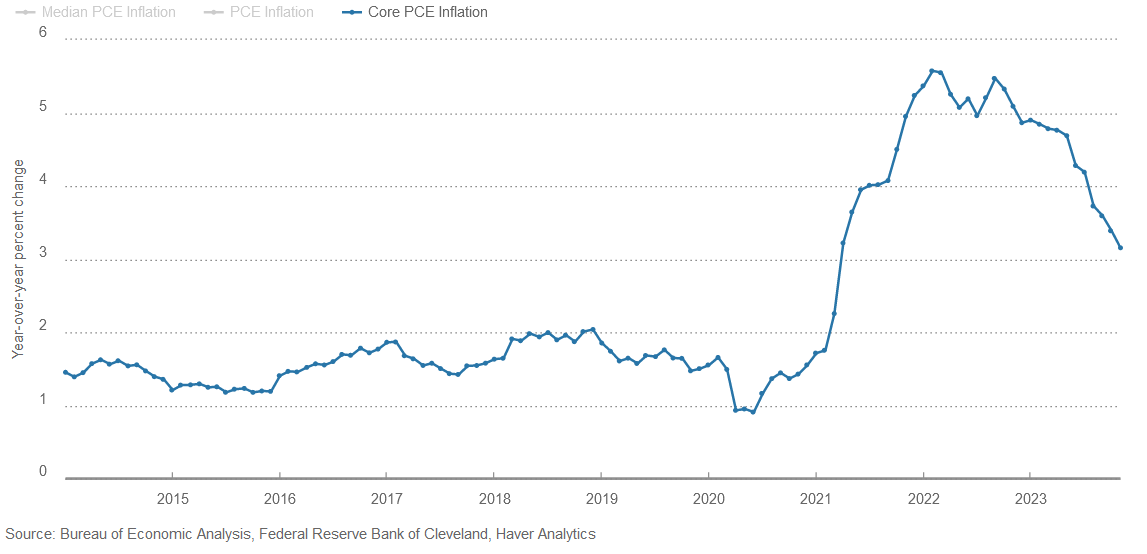
Both “Core” measurements discard the prices of Food and Energy, which are both volatile and change quickly. The famous “Egg Inflation” situation in 2022, avian flu outbreak, which killed millions of chickens, is one example. With that said, lets go ahead and look at nationwide gasoline prices, arguably a commodity the majority of American consumers directly pay for:
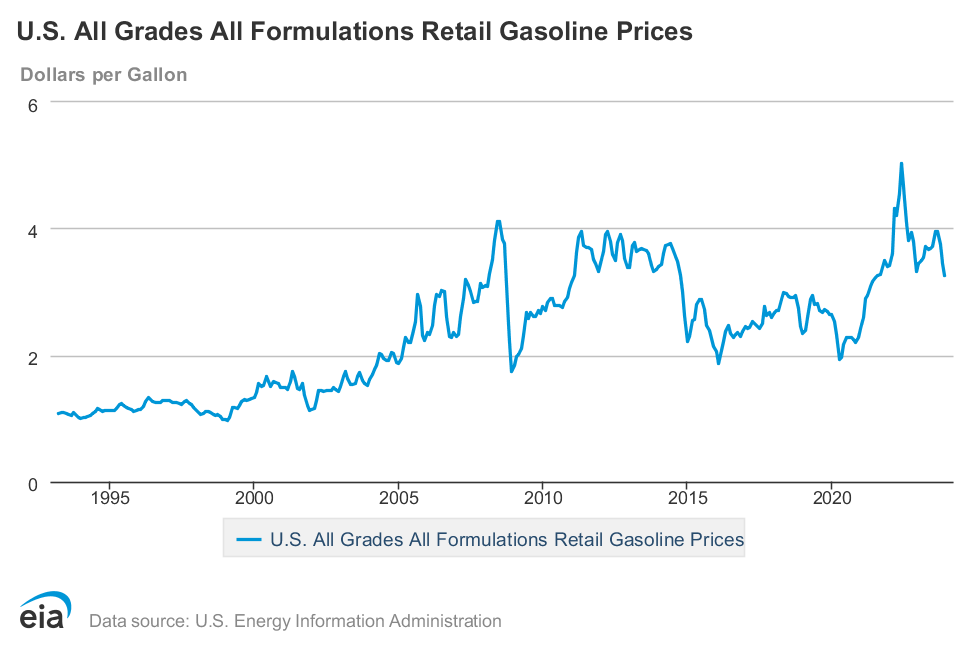
As can be seen, after peaking in summer 2022, prices have come back down, almost to 2008 levels. This is even with the tensions in the middle east and other places.
Overall sentiment and mood of the consumer:
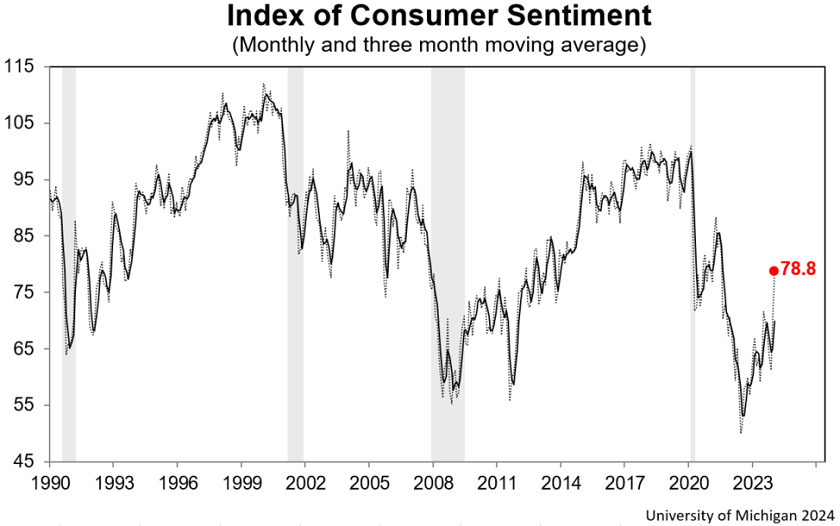
Consumer sentiment increased (improved) 13% in January to reach its highest level since 2021. Consumer sentiment has been improving since late 2022. Consumer’s apparently believe that inflation has turned a corner and have recently improved income expectations. University of Michigan (who compiles this data) Chart:
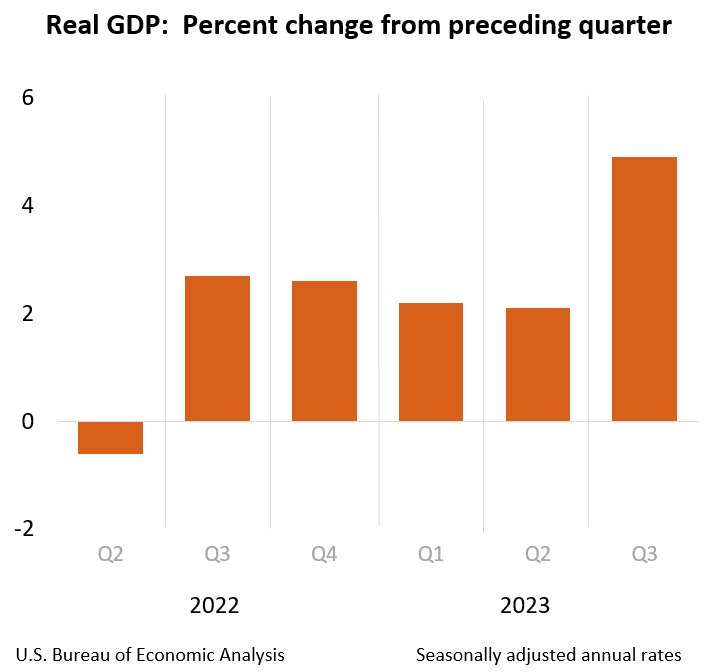
Gross Domestic Product (GDP) data is also improving. GDP measures the value of the final goods and services produced in the United States (without double counting the intermediate goods and services used up to produce them). Changes in GDP are the most popular indicator of the nation’s overall economic health. Chart:
So in light of the above data, I feel confident to continue my allocation of 50% S-Fund and 50% C-Fund. This “early” into the year, I feel this is the right balance. In a few months I may modify my allocations but until then, I am in the S and C-Funds. Note that this is an election year, as we get into mid-2024, the market behavior may change (or not). An interesting indicator, with a record of being correct 85% of the time, is the Presidential Predictor, developed by Sam Stovall: 2012 article: https://www.businessinsider.com/stovall-stocks-predicted-president-with-88-accuracy-2012-11
According to this indicator, a S&P 500 rise from July 31 to October 31 traditionally has predicted the reelection of the incumbent person or party, while a price decline during this period has pointed to a replacement. Again, this indicator has an 85% accuracy record, so it bears paying (some) attention to.
Thank you for reading…I will keep the updates coming when significant events warrant them. Please continue to share this website/email blast with your friends and colleagues.
-Bill Pritchard
Website main link: https://www.thefedtrader.com/
