
Last week, the stock markets continued their COVID-19 triggered crash, resulting in the worst week for the Dow Jones and S&P 500 indexes since 2008 (12 years ago). You may recall that I changed my asset allocation in my TSP to 75% G-Fund, and 25% C-Fund, triggered by the deteriorating market and the penetration of 2700 on the S&P 500, resulting in a “official” bear market status. In mere weeks, the indexes have given up ALL gains from 2018 and 2019. ALL of them.
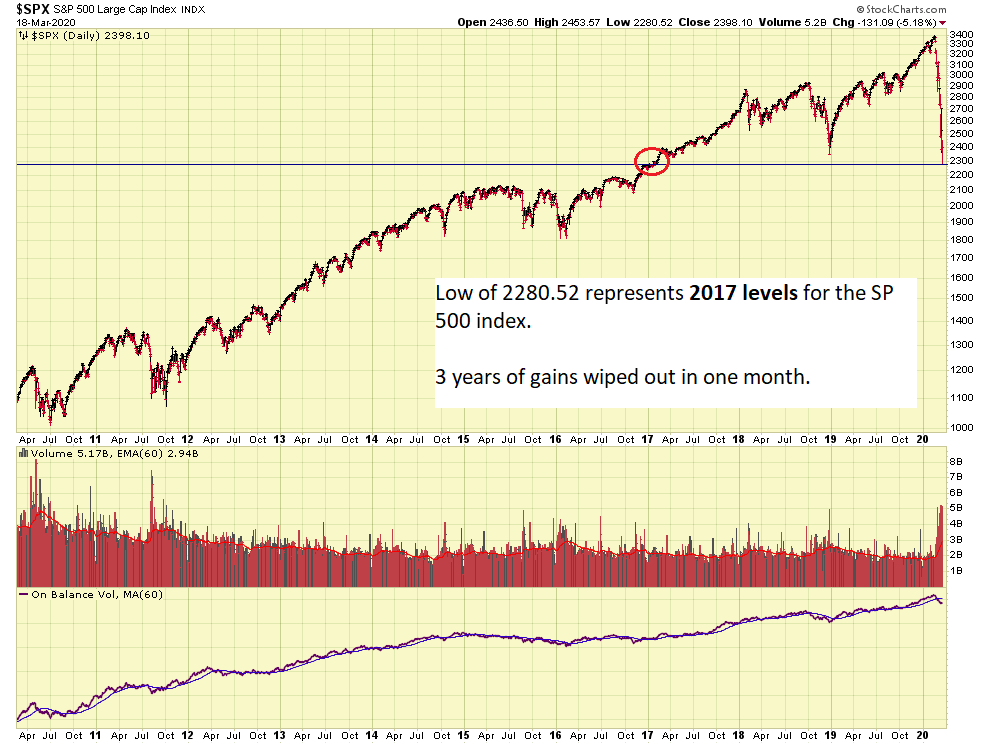
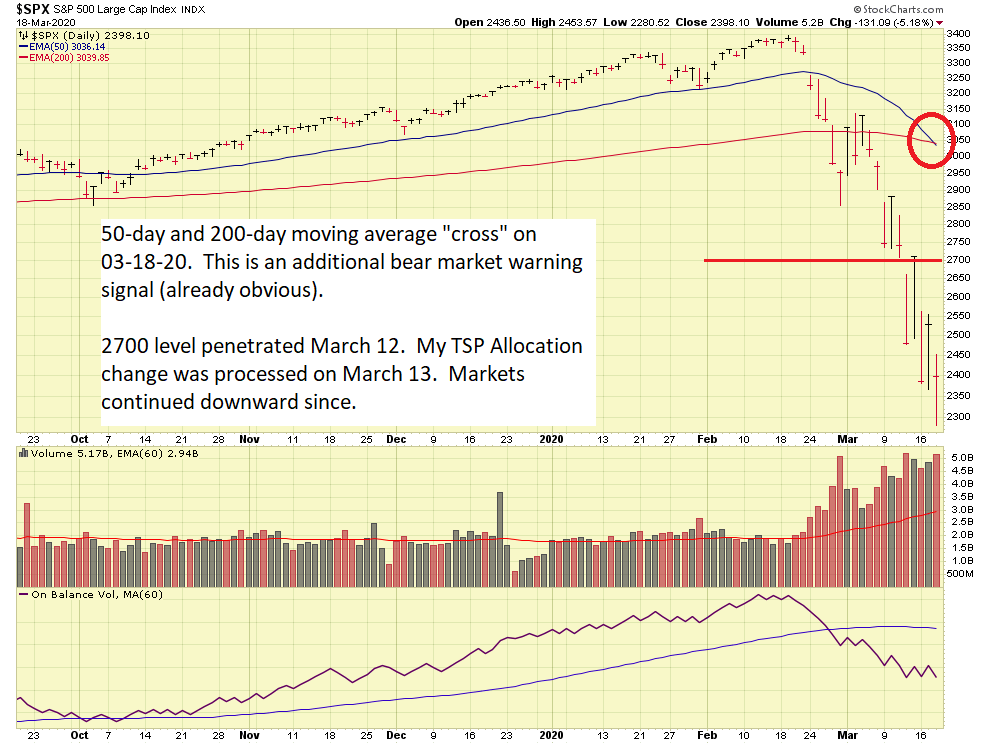
Plainly visible in the above charts is the penetration of 2700, resulting in an “official” bear market (20% decline from an all time high), and also the cross of the 50-day and 200-day moving average. This “cross” is a very common trend identification tool, used by thousands of institutional investors. I guarantee you that many people are watching these levels and trends, and additional selling will soon follow in the future.
As previously mentioned in my FAQ, major market trends, to include Bull and Bear cycles, are driven by catalysts. Indeed, a global virus outbreak and pandemic, can serve as a catalyst.
Evidence indeed exists that this is a very dangerous situation- my personal stance has changed somewhat (once presented with facts, I tend to shift my views…usually…) in recent weeks. The world is on lock-down of varying degrees, for the first time in history, people are encouraged to not go to work, to not socialize, and to stay inside. The global economic impact of this will be catastrophic. It is of such proportions, that even Gold is not safe. Investors are selling gold to raise cash, as “cash is king” right now. See chart:
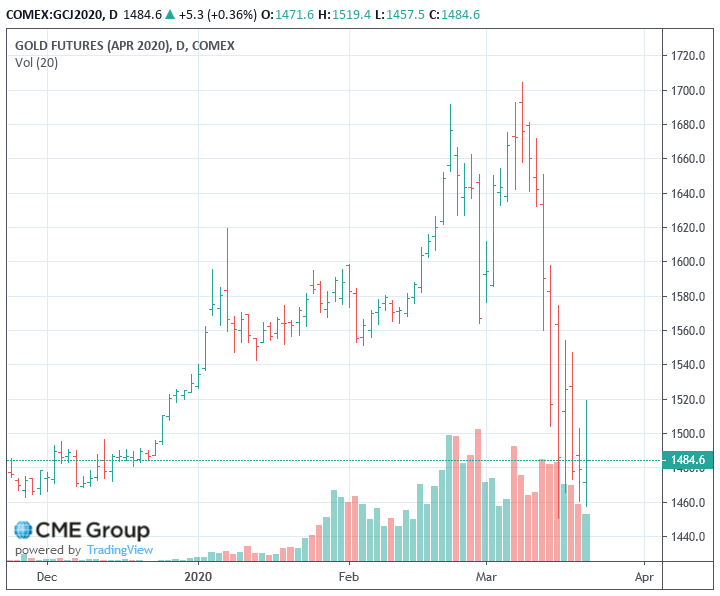
Visible above is the mini-crash going on in Gold now. So when you squeeze the water balloon on one end, the water goes somewhere else, and makes the other end expand, does it not ? Investors are raising cash, which is driving the “value” of the dollar higher, as indicated on the US Dollar Index chart below:
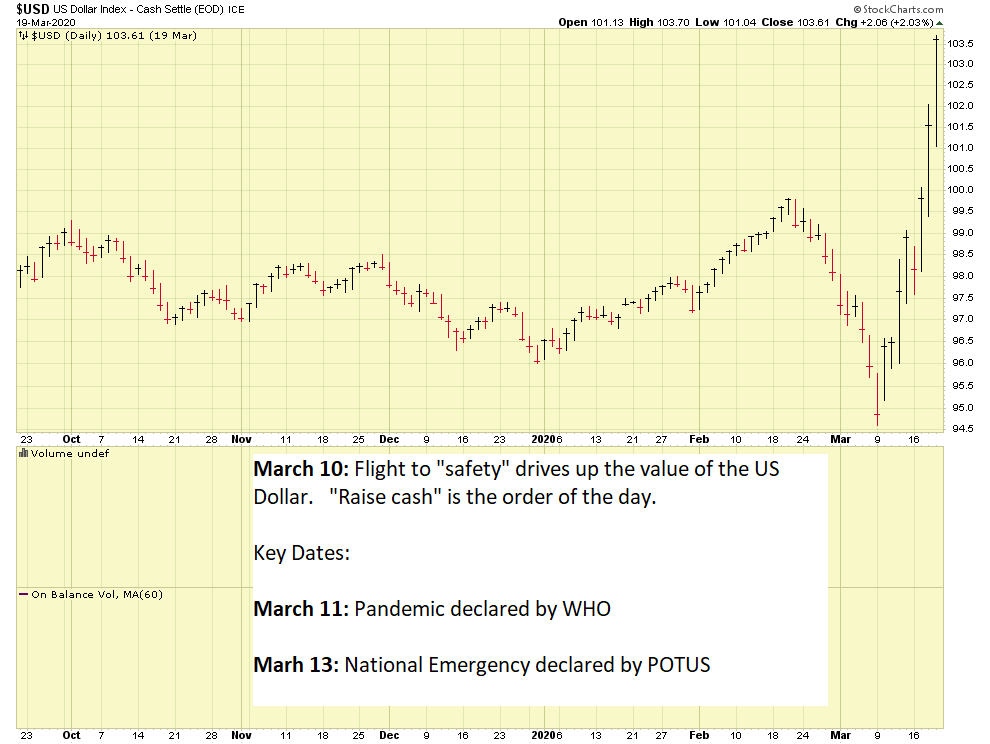
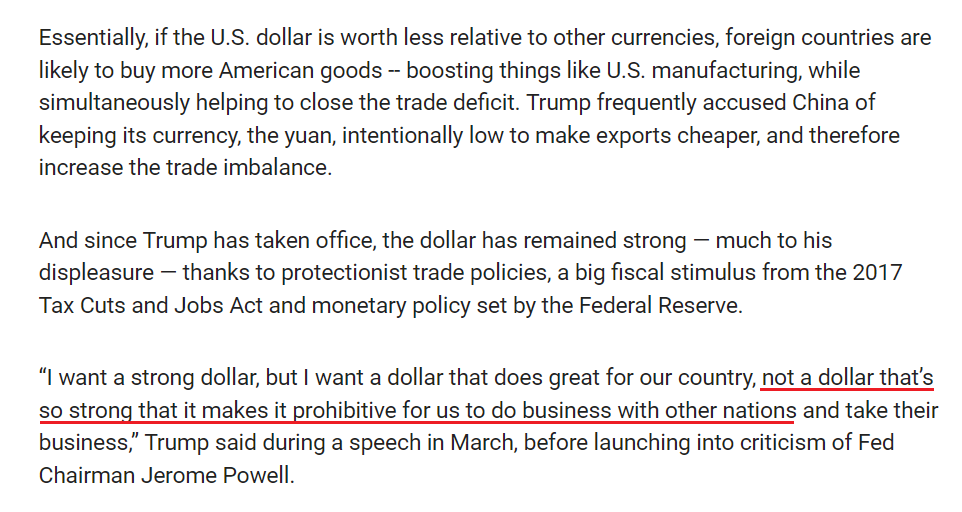
The increasing strength of the dollar, having begun on March 10, is not desired by President Trump, who publicly has denounced a strong dollar because it impacts trade. Fox News Business provided a 2019 article where this can be further explored: https://www.foxbusiness.com/economy/trump-weaker-us-dollar
 So stock market aside, there are other cracks in the foundation appearing, notably the strength of the US Dollar. Furthermore, we still do not know the true impact of COVID-19, but preliminary figures are starting to trickle in. For example, one sector hugely impacted is the aerospace and airline industry. Transportation and Security Administration (TSA) checkpoint travel numbers shows that passenger counts are down 50 to 80% from the same time last year:
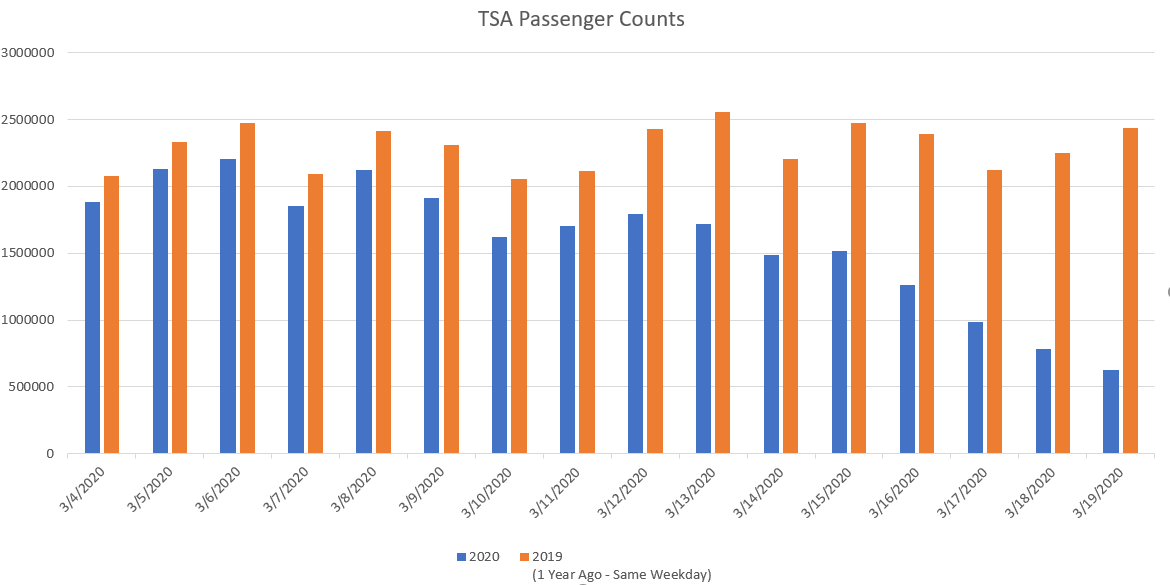
I imported the data into a simple Excel graphic to allow a visual depiction of things. Passenger counts are drying up, exasperated by lock-downs and restrictions in major travel states of California (LAX, SFO) and New York (JFK, LGA). Hawaii will soon impose 14 day quarantines for all inbound visitors.
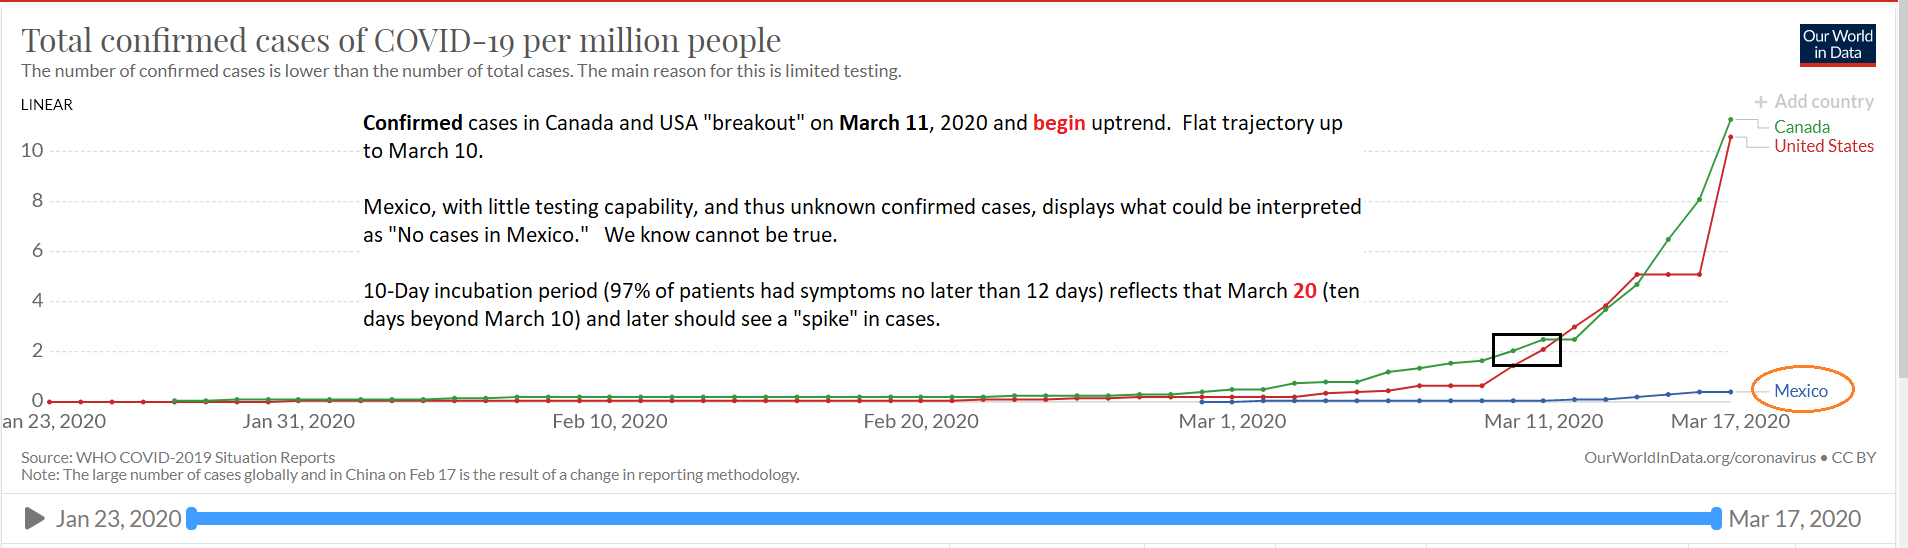
Economic talk aside, lets talk about COVID-19. I am calling March 10, 2020 as the date that USA began to realize that COVID-19 was a threat. The outflows to the dollar began that date (“smart money” was behind this move), the market attained Bear Market status on March 11 (no doubt driven by decisions on March 10 and prior), and a noticeable uptick in COVID cases began that date:
TSA travel date reflects a drop-off of travel starting March 7, then a clear breakdown March 10 and after. On March 12, I inputted my asset allocation change to the TSP, and largely avoided the bloodbath which happened last week.
I will not bore you with COVID-19 charts and graphics, plenty exist on the internet. It is sad to report that we have surpassed Spain in the number of cases. Communist China, who kicked out reporters, and are the likely culprit for introducing this to the world, is not to be trusted for reliable reporting. I hear people on the cable news shows state that “China does not have a problem anymore” etc. I doubt that is the case.
As I stated in a prior post, my opinion is that reported cases for the United States will be drastically higher in April, due to the 14 day incubation period from mid-March, and due to increased (more) testing sites. Behavior-based measures (self quarantine, social distancing, etc.) did not really begin until mid-March. Only a few days ago did the majority of people really start to take this seriously (at least in my view). Hence, I think it is fair to say that we are about to get a huge amount of confirmed cases in the coming weeks.
Moving on….Any federal bailout package will not be without attached strings; cash hand outs (taxpayer funded) to for-profit corporations are less likely than government loans, with qualifying requirements. Probably every business in America will benefit from assistance. The hospital industry alone is reportedly in need of $100 billion just to ramp up COVID-19 related capacity and infrastructure.
So how long will this crash/correction last ? Attached is a chart I made of the S&P 500 index going back 30 years, with comments on the chart:
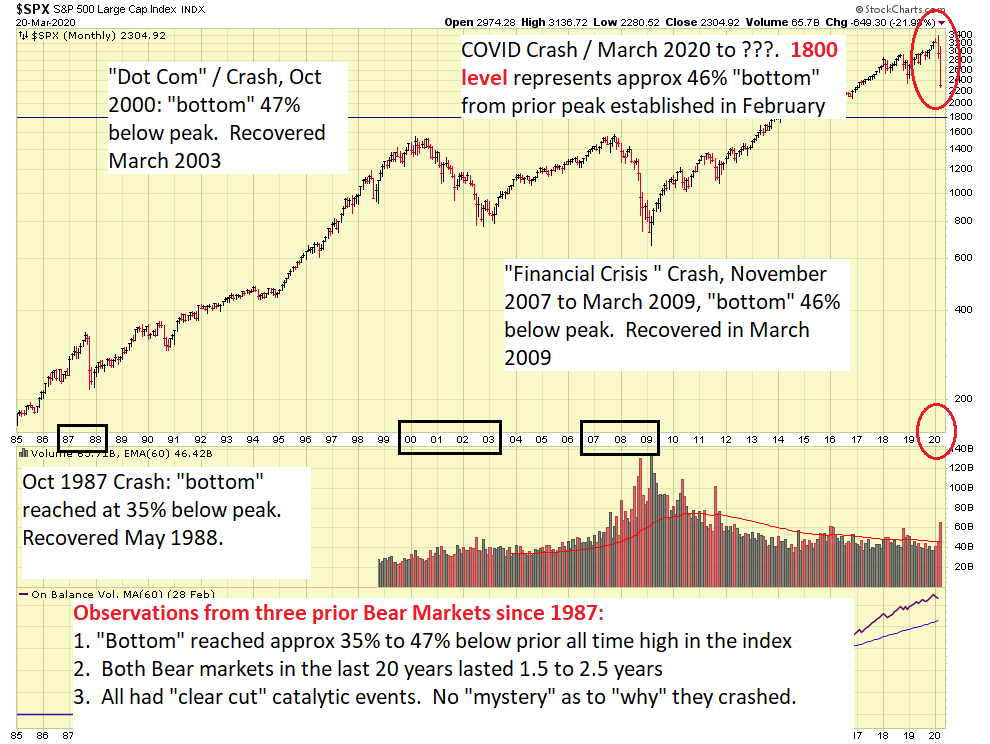
If history is any guide, the “bottom” is not going to be close until at least 35% to the downside is reached, or 2200, at the very least. The financial crisis of 2007-2009 and the “Dot Com” bust of 2000 witnessed a decline of 47% until the “bottom” was reached. A 47% loss today is located at the 1798 level. We can round this up for simplicity to 1800, and keep an eye on 1800 to 2200 as a possible “bottom zone” with the assumption that history will be a reliable guide for us.
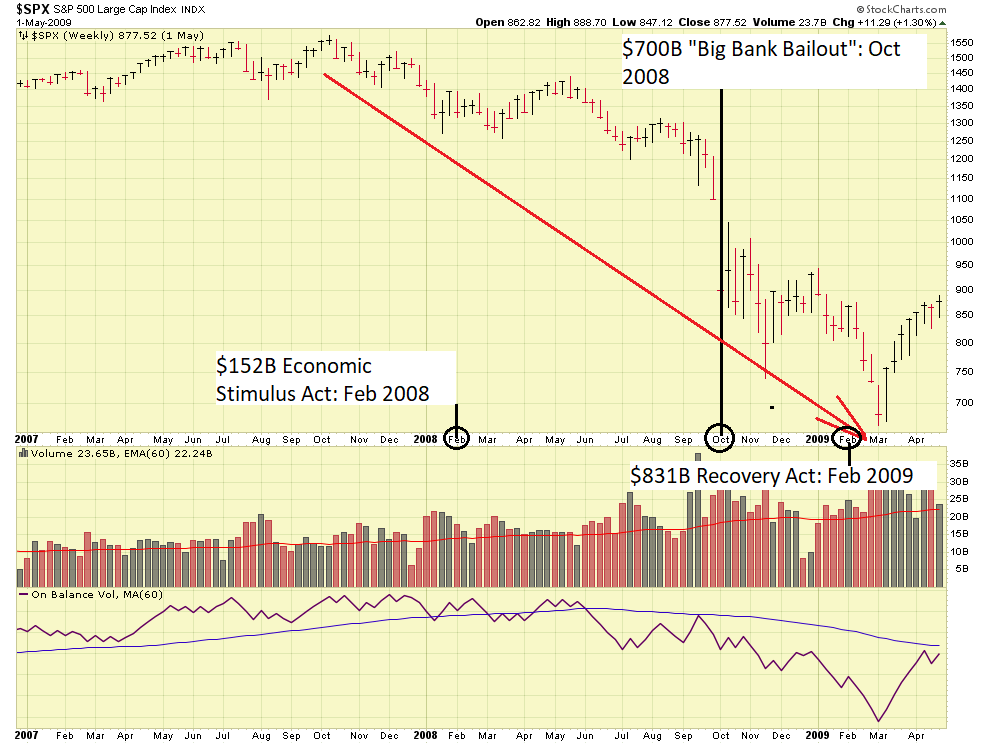
So the next question might be, “Do Bailouts work?” In the 2007-2009 Financial Crisis, they did not seem to help:
Only time will tell if our elected officials can work together, and put together a package to help the economy. More importantly in my opinion, is find a solution to COVID-19.
Thank you for reading. As always, please share this email and my website with those who may benefit from my opinion based analysis of the markets. You can subscribe via this link: http://www.thefedtrader.com/contact-us/
Lastly, if you have not already done so, please participate in my poll, which I intend to close after 30 days, located at this link: https://www.poll-maker.com/poll2788829xc18a487c-82
Thank you….talk to you soon
-Bill Pritchard
