Good Evening everybody
How time flies, my last post was in July. As you may know, I have retired from the DEA. Let’s talk about the markets and recent developments, namely “the new COVID variant” (grumble grumble).
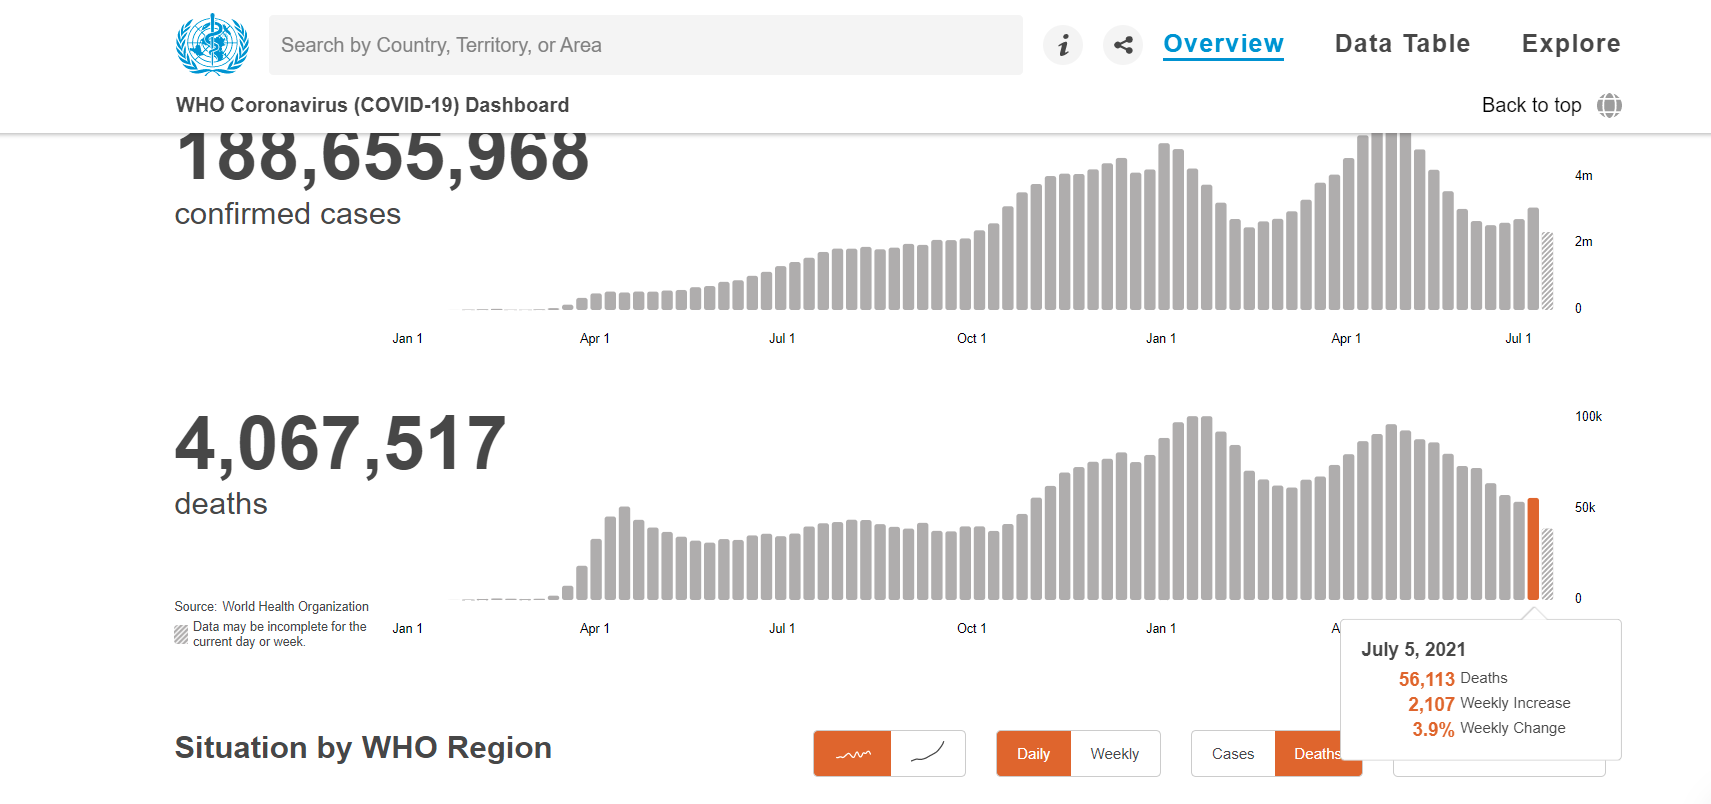
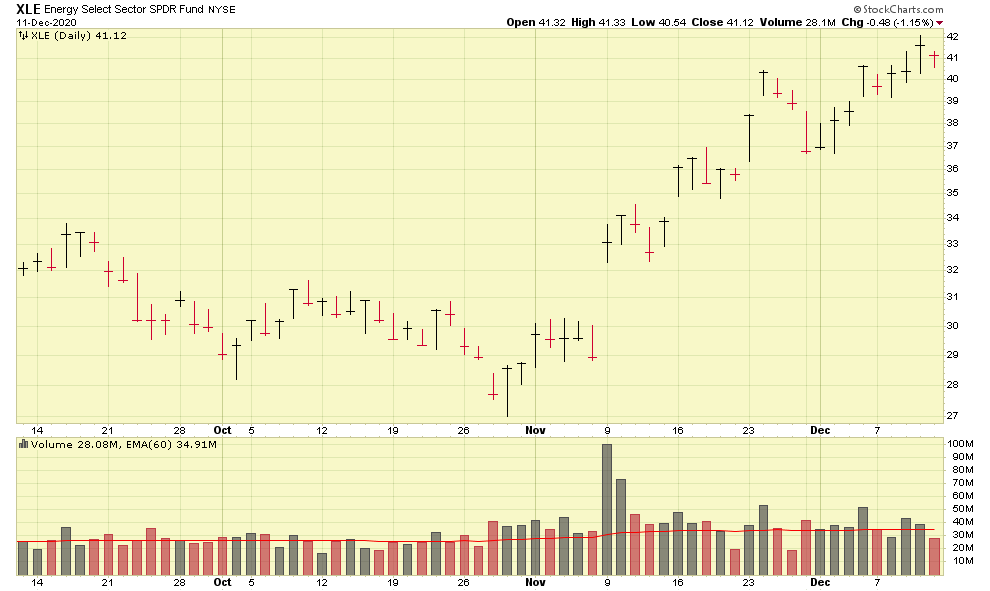
Looking backward, at the last six months, the C-Fund has outperformed all the other funds, with the S-Fund taking second place, up until about a month ago, when the I-Fund outperformed S-Fund. Enter the “new COVID variant” which was reported to the World Health Organization by the South African health authorities on November 24, which triggered a market sell off on Friday Nov 26.
Presently, my crystal ball tells me that the funds most susceptible to damage from a sell-off will be the I-Fund, then S-Fund, then C-Fund. I-Fund due to international exposure, S-Fund due to smaller-sized companies and inabilities to sustain economic damage, and lastly C-Fund, all super large companies with ostensibly some protection from short term “new COVID variant” damage. Clear as mud? Basically, in my OPINION, if you are 100% I-Fund, you might consult your professional advisors and/or make your own educated decision for your own account and consider reducing some I-Fund exposure. My OPINION is that (especially for the retired…) a balance of 25% C-Fund (see above comment regarding protection from damage) and 75% G-Fund, the same allocation I discussed in my July post, is still a sensible allocation, again, in my opinion.
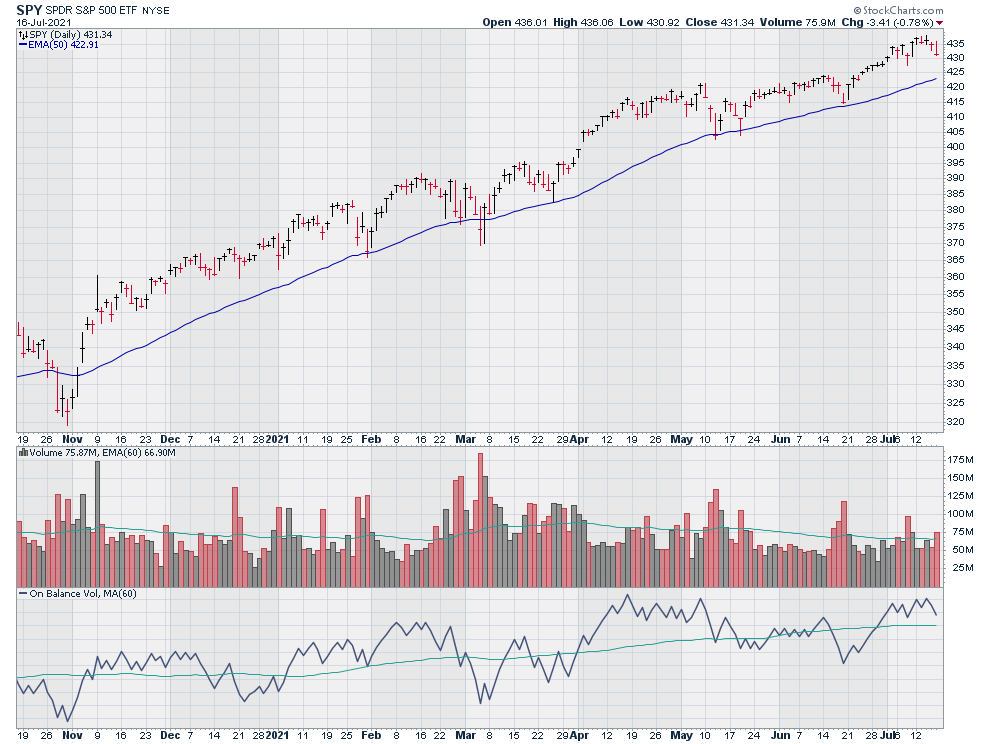
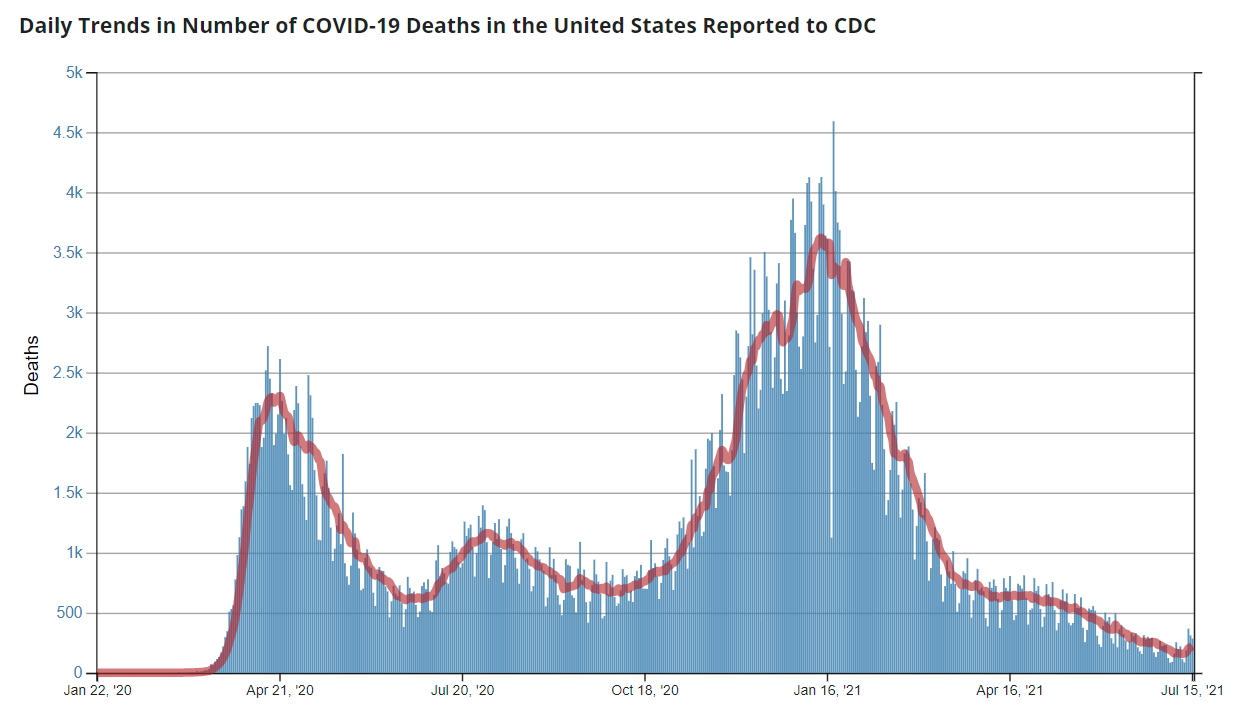
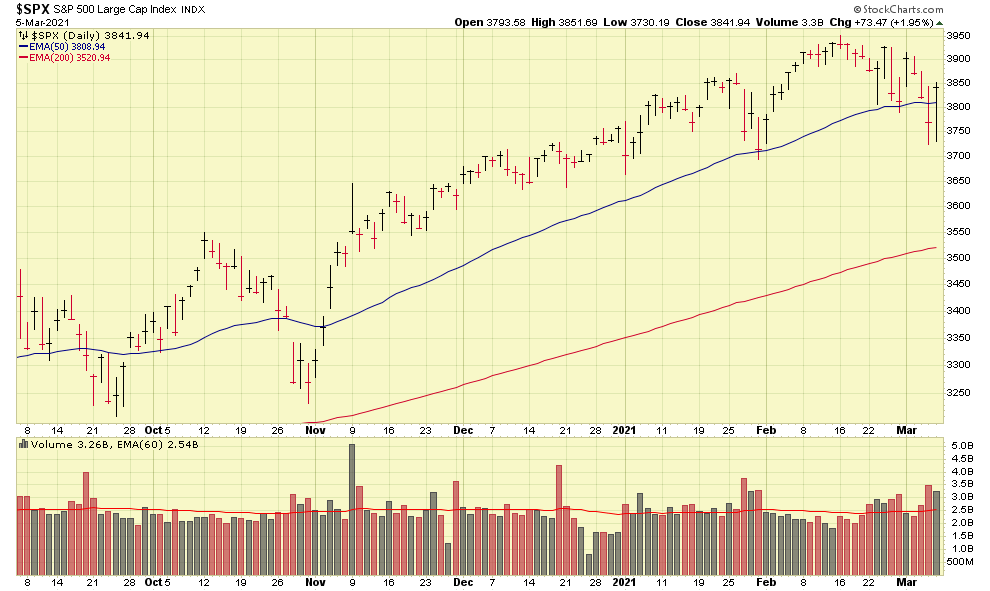
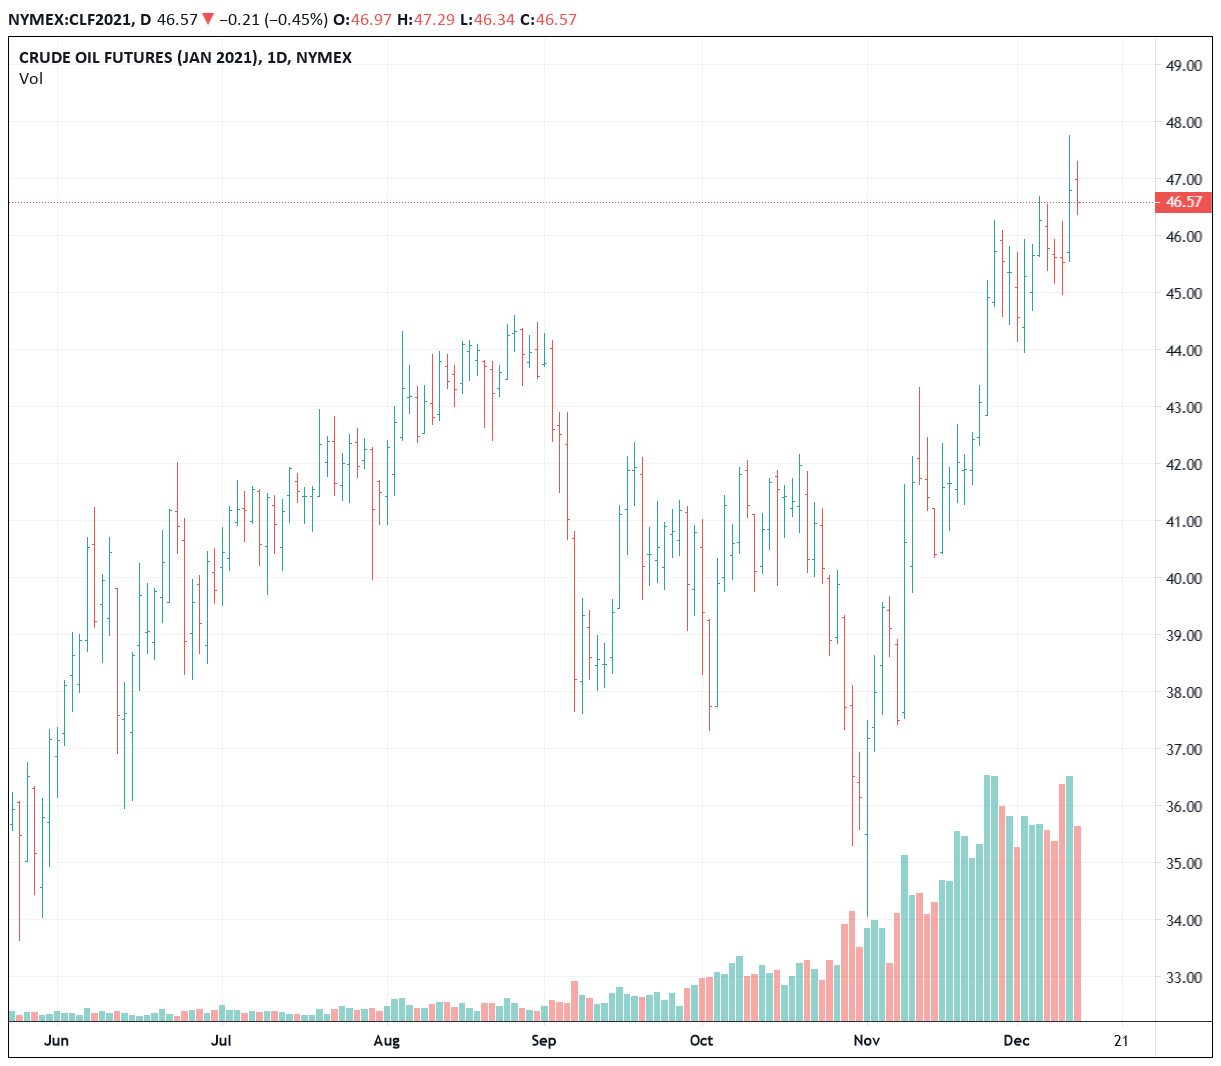
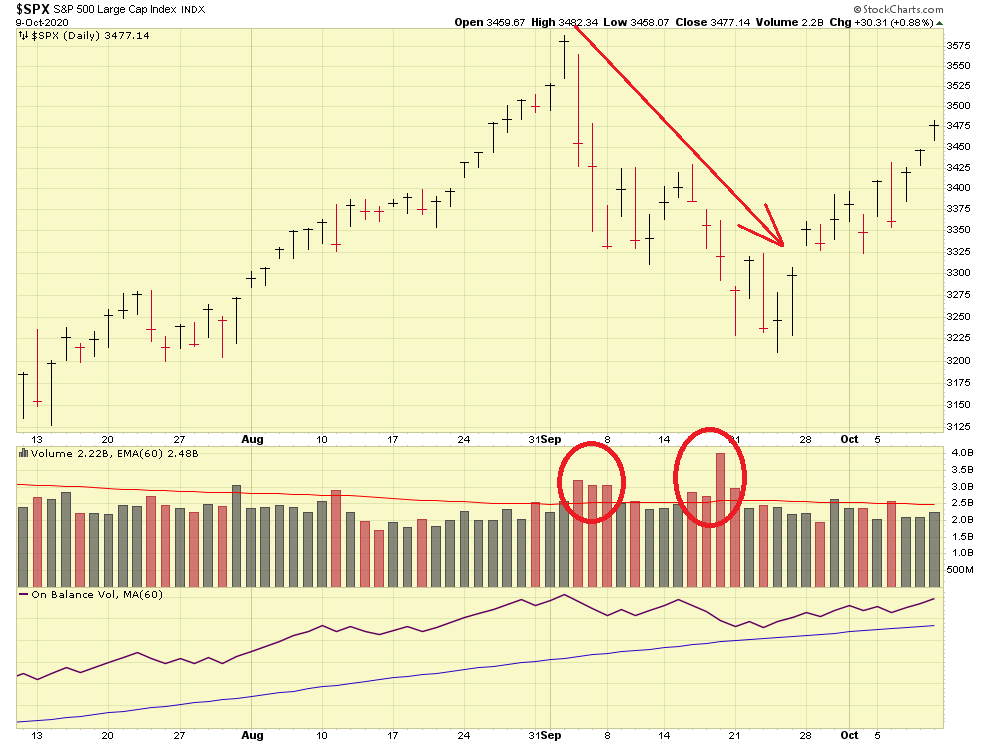
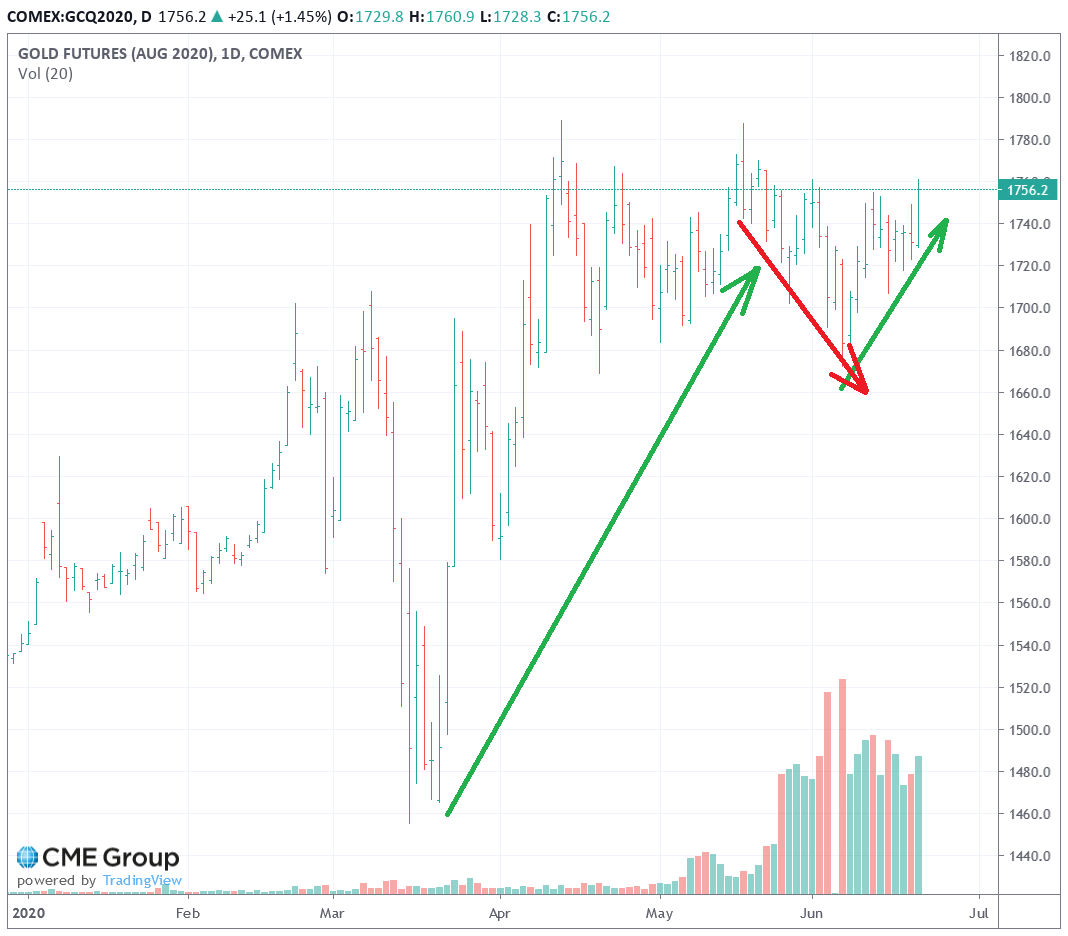
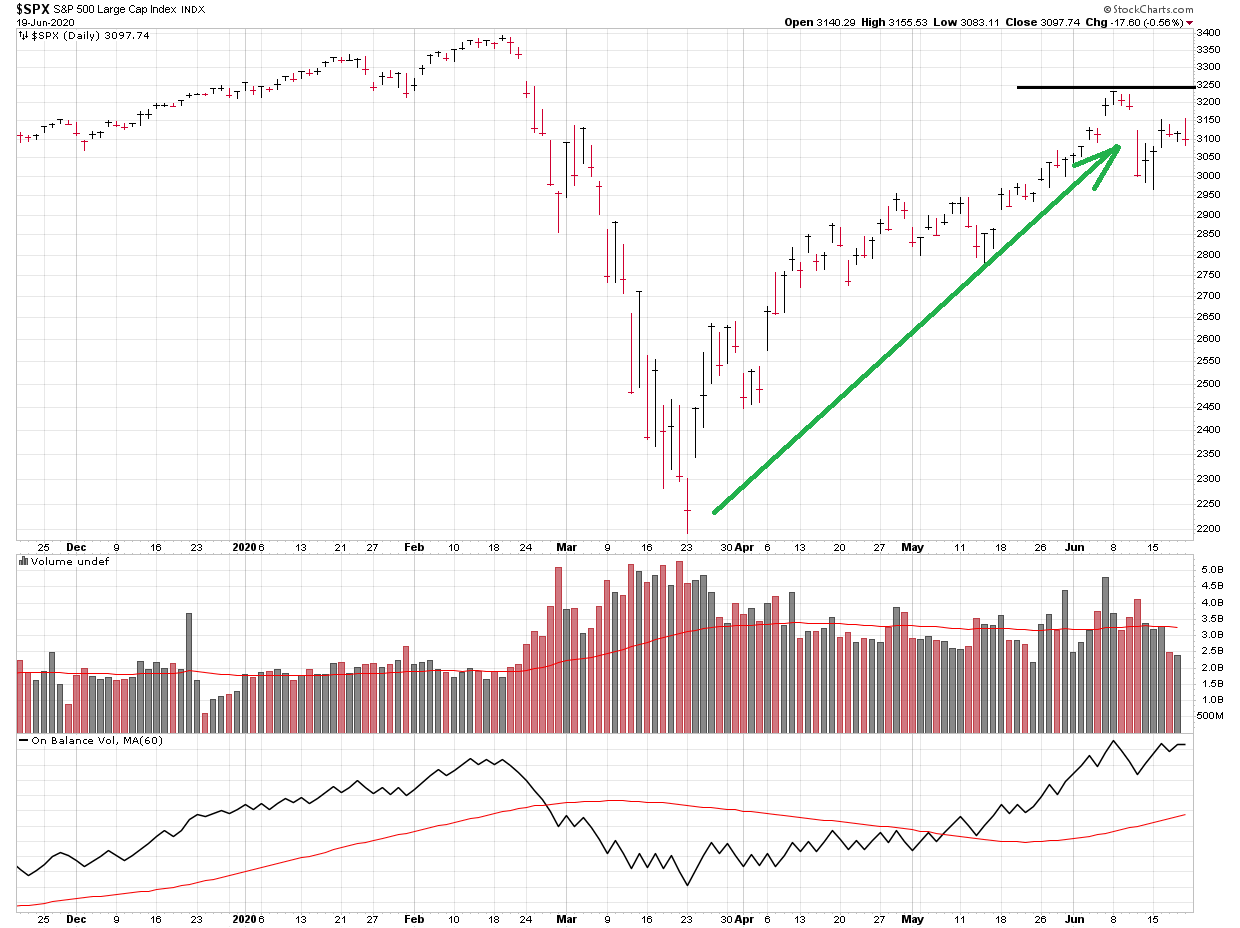
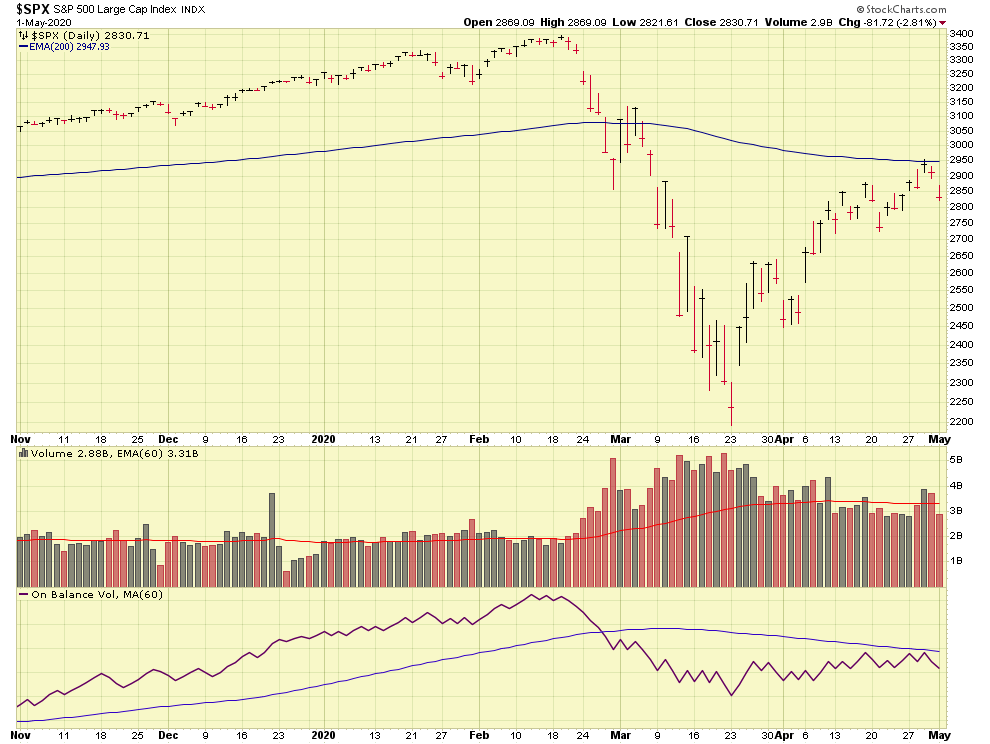
Lets take a look at the original 2020 COVID crash:
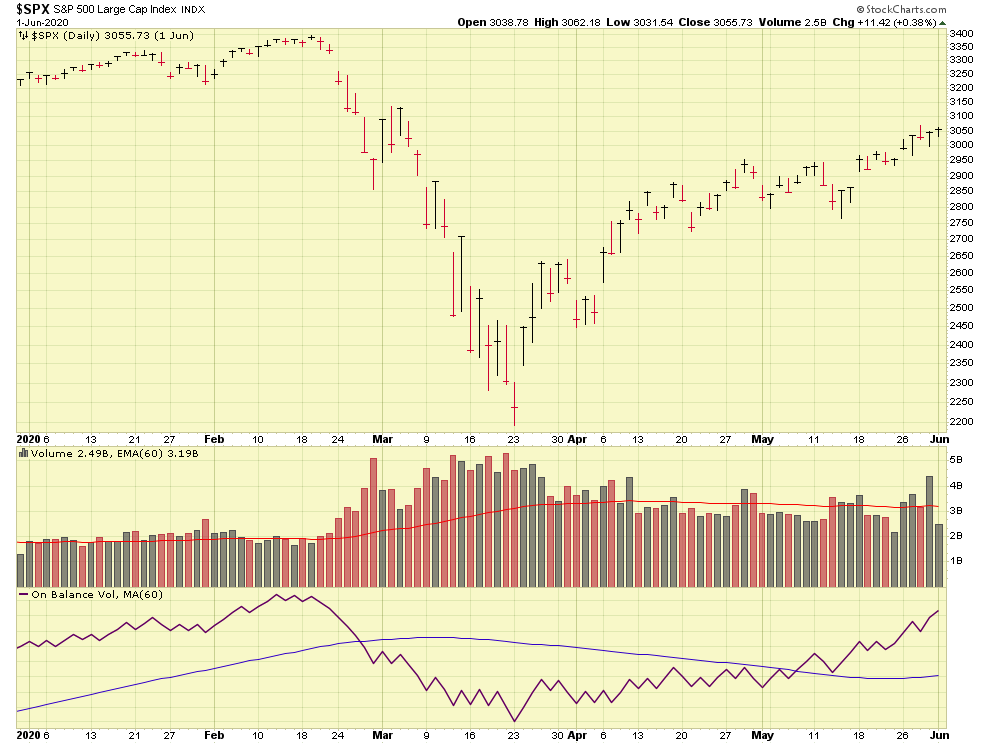
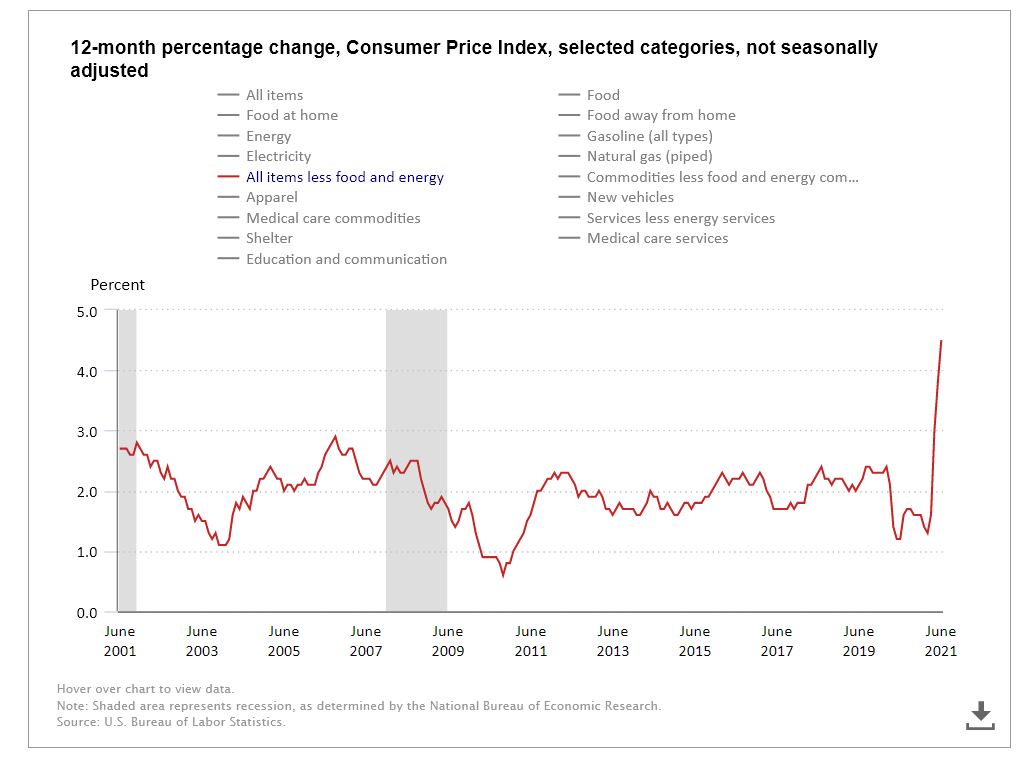
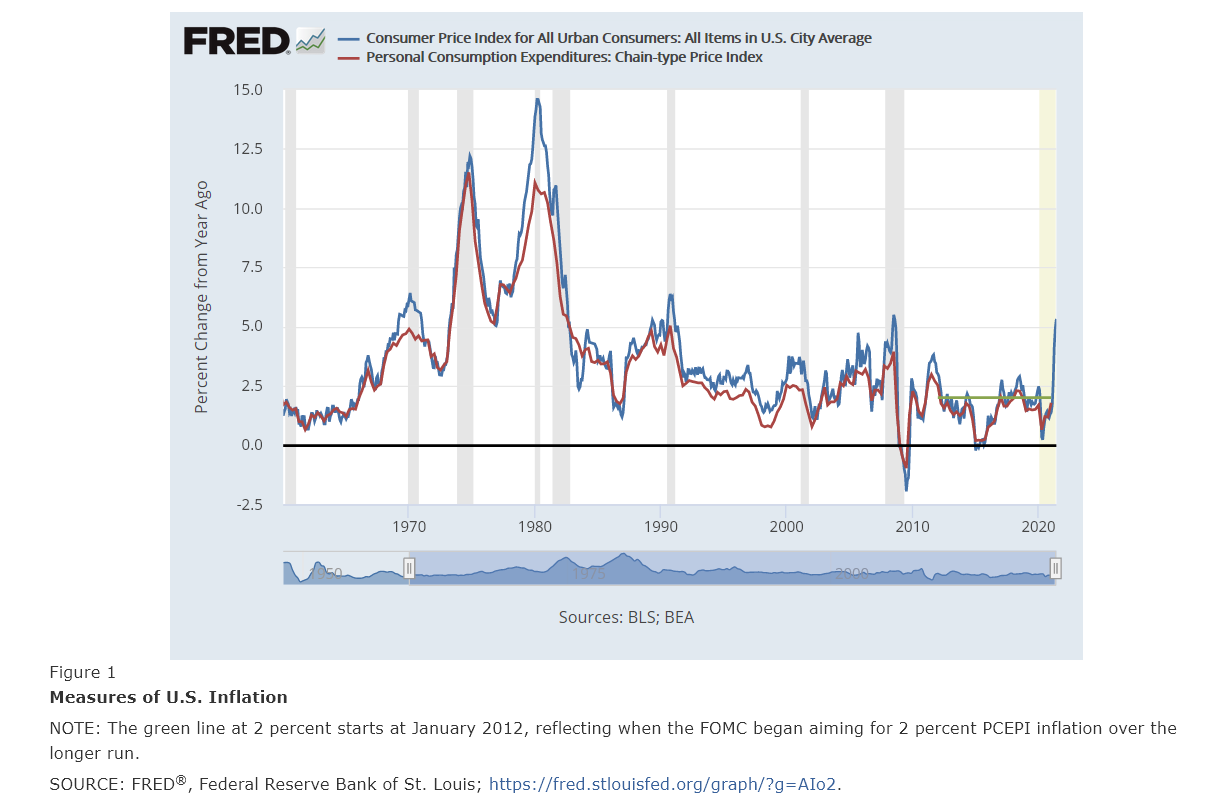
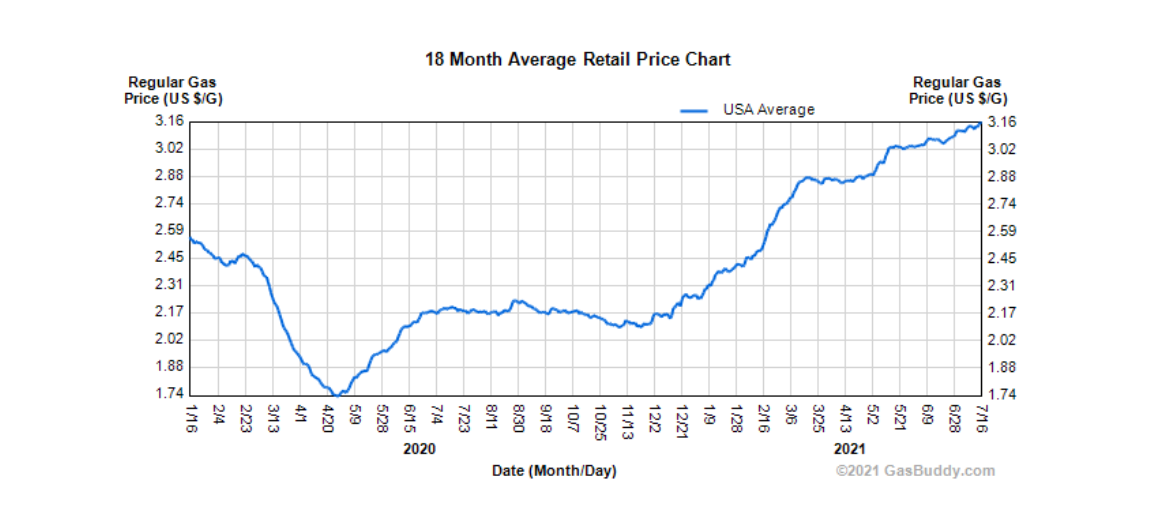
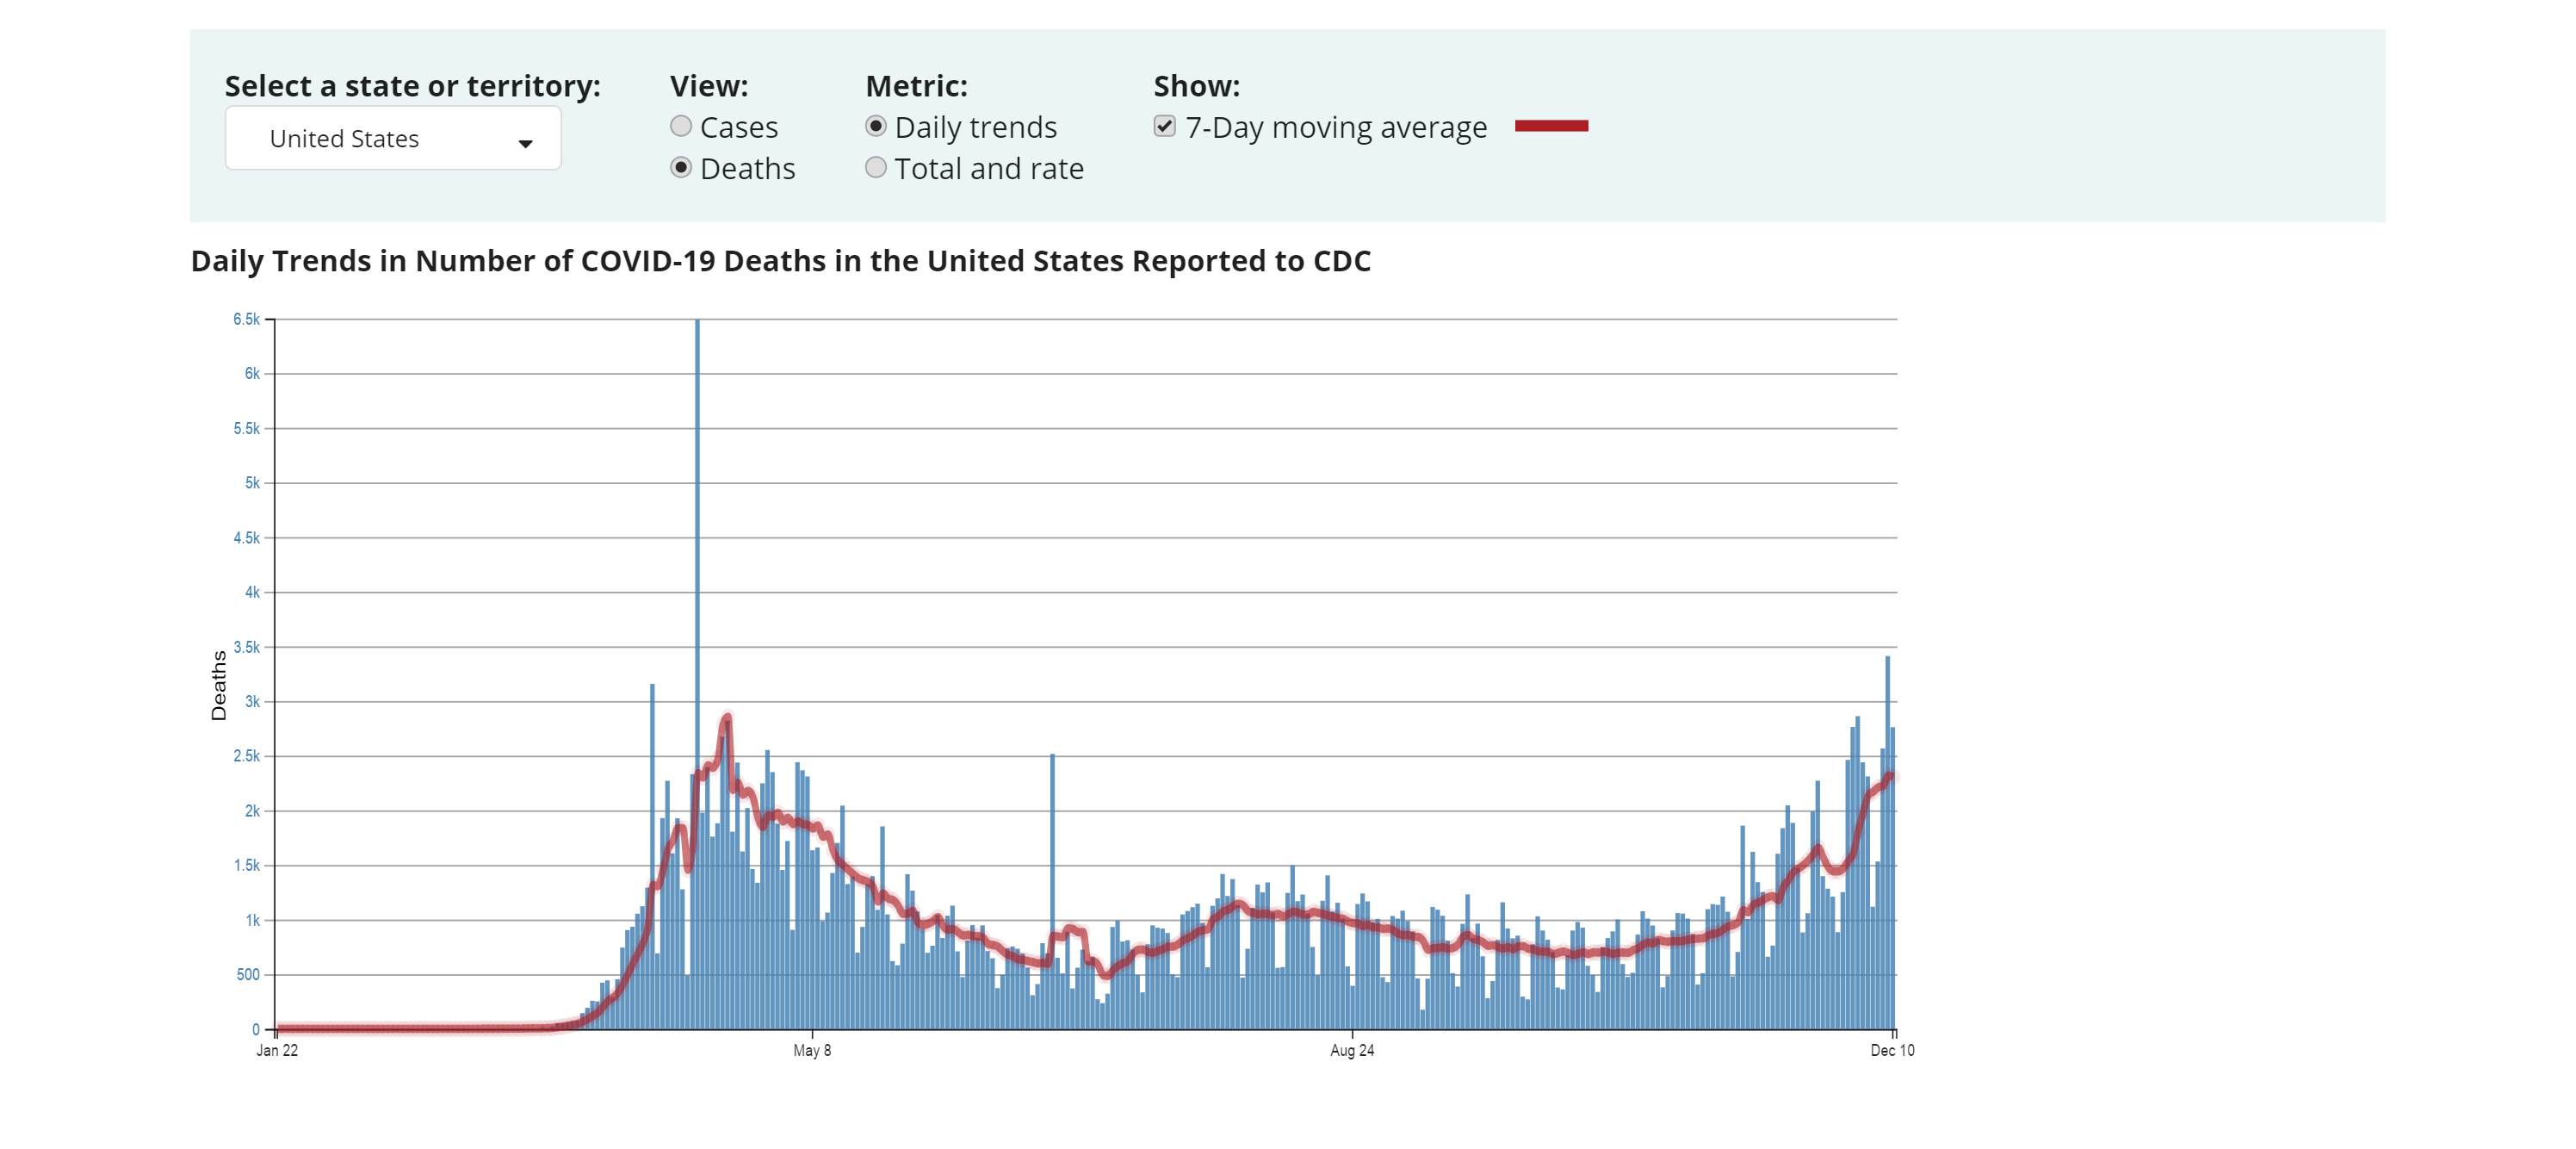
As you can see, the market began to deteriorate on February 24, 2020, and began to recover on March 23, 2020, or almost a month later. What will happen this time? Who knows, that is anybody’s guess. However one observation I have is that the stock market, and the economy, in early 2020, both were at all time highs, and rather healthy. Then COVID came along, and indeed caused havoc. Presently, now, today, the economy has some other concerns, most notably inflation, and some areas have still not healed from COVID-2020, such as the supply chain (chips for new cars, etc.). Frankly, the “new variant” is the last thing we need, just when things had started to recover. I am not fear mongering but just calling it how I see it. Also important to note is the development of vaccines, which may mitigate impact of this new variant. As of the publication of this post, the “new variant” (being now called Omicron) has yet to be found in the USA.
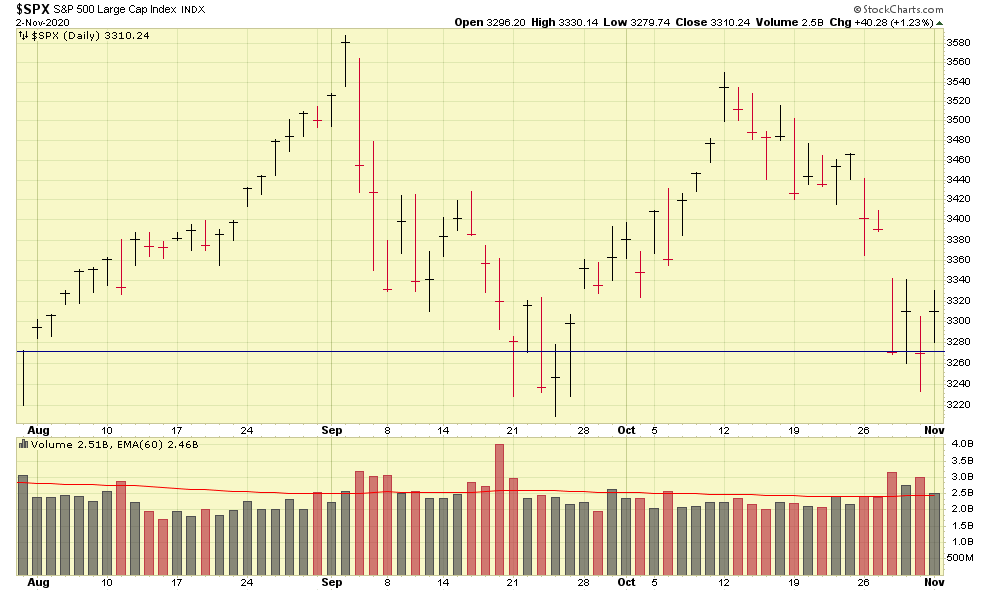
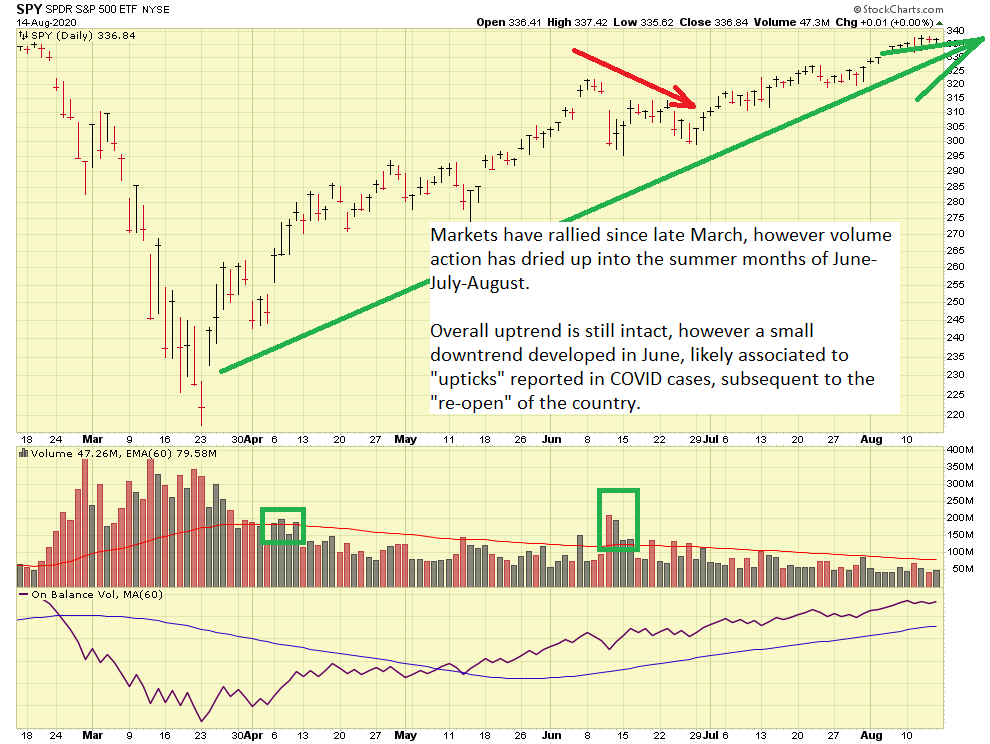
Moving on, lets answer if the sell off is “real” or just panic. Well, any sell off is real, but lets dive deeper behind the scenes, and try to determine if this is the start of a new downtrend or not. Disclaimer, this is somewhat crystal-ballish, but lets do it anyway. Keep in mind that Friday was the day after Thanksgiving, historically a day when most market participants are away from keyboards and their Bloomberg terminals. Friday was also the worst performing day of the year for the Dow Jones index.
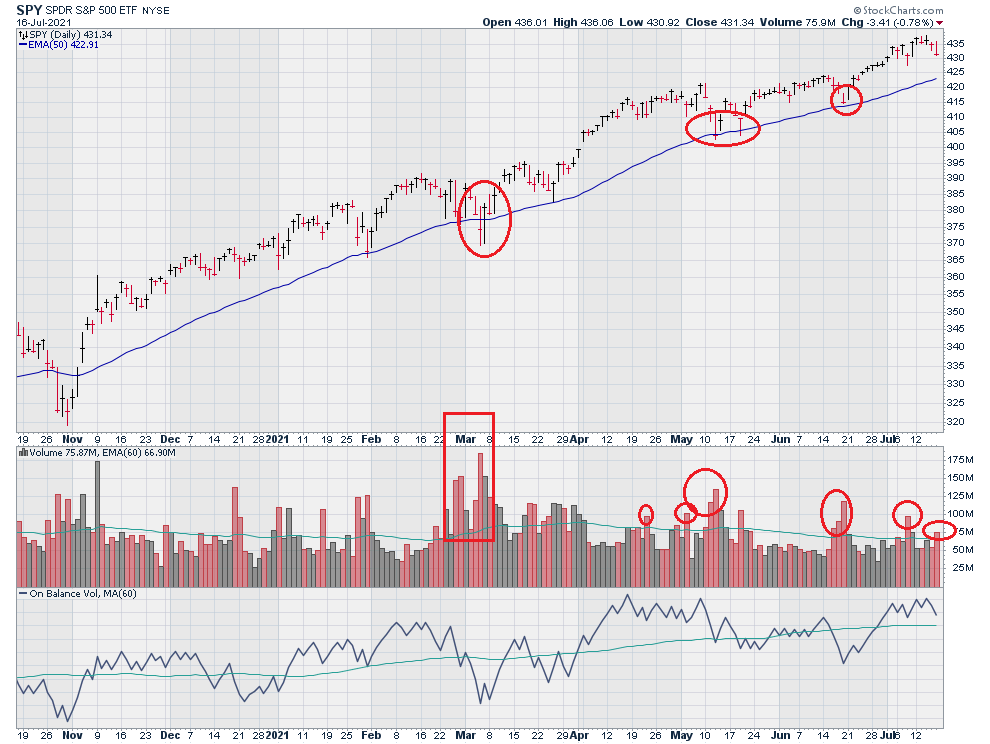
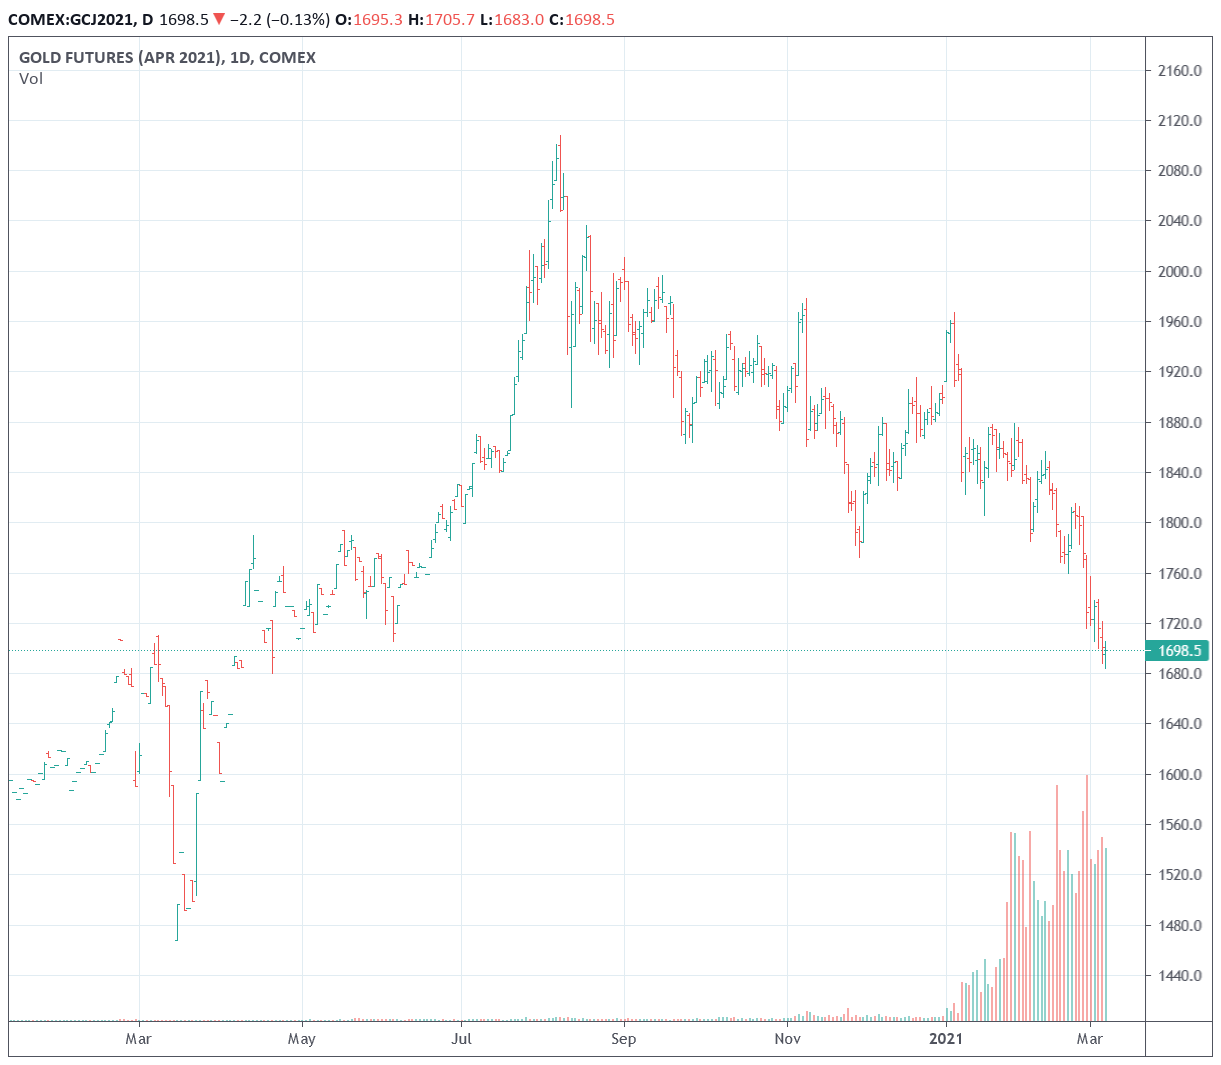
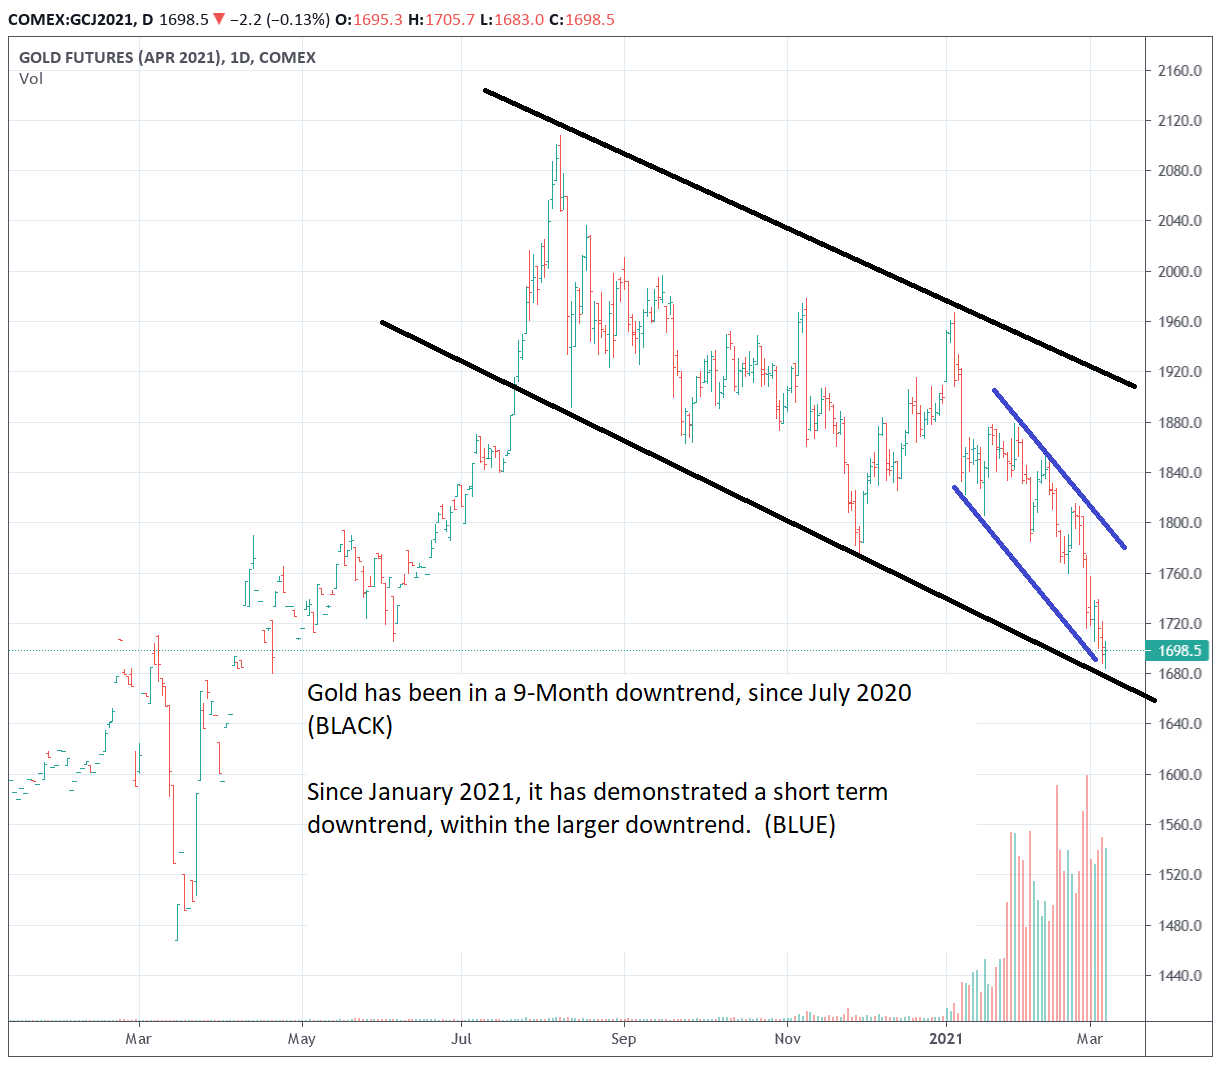
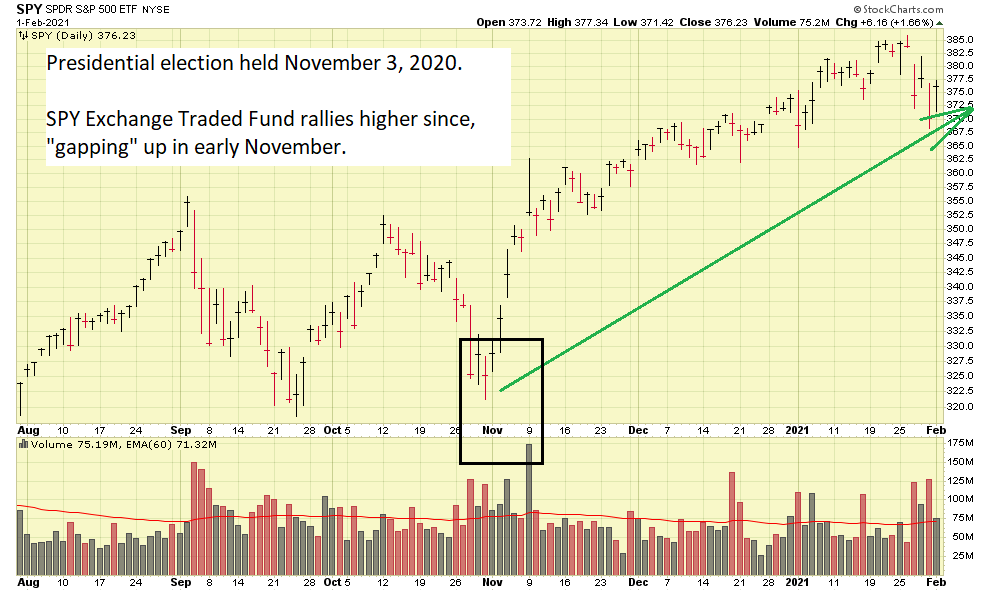
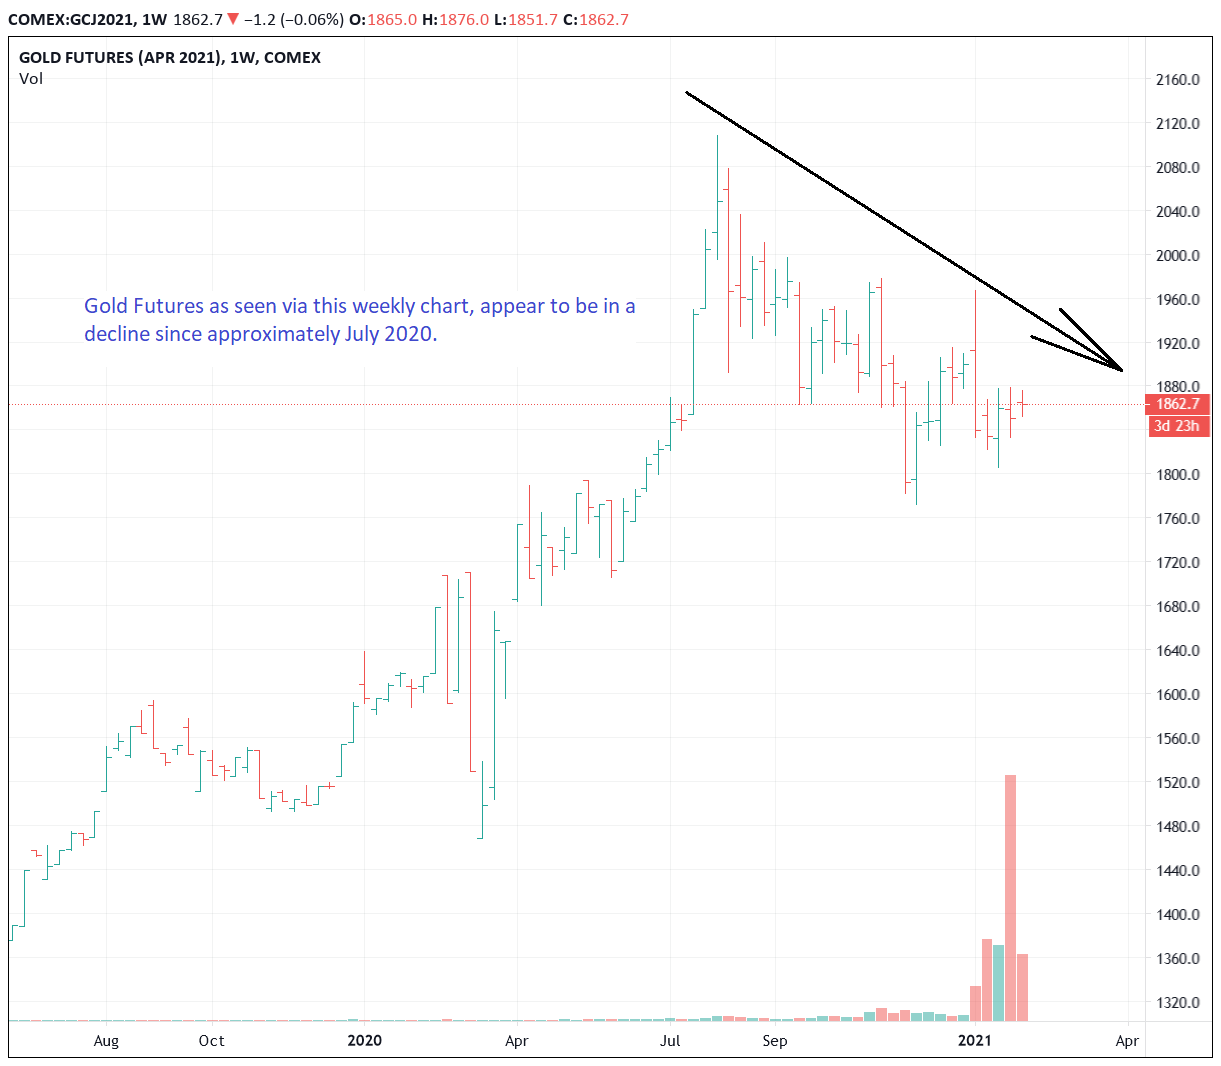
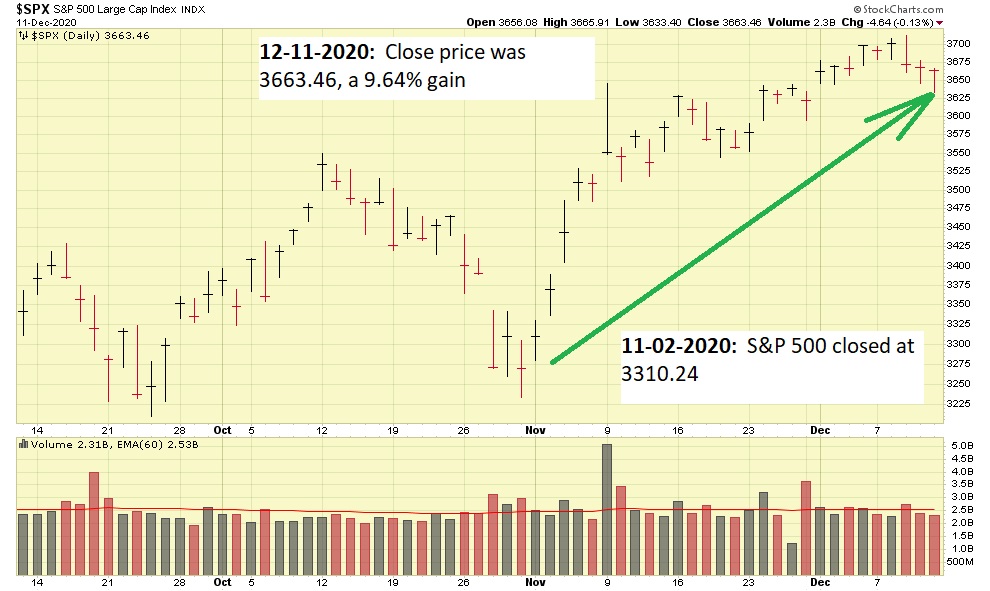
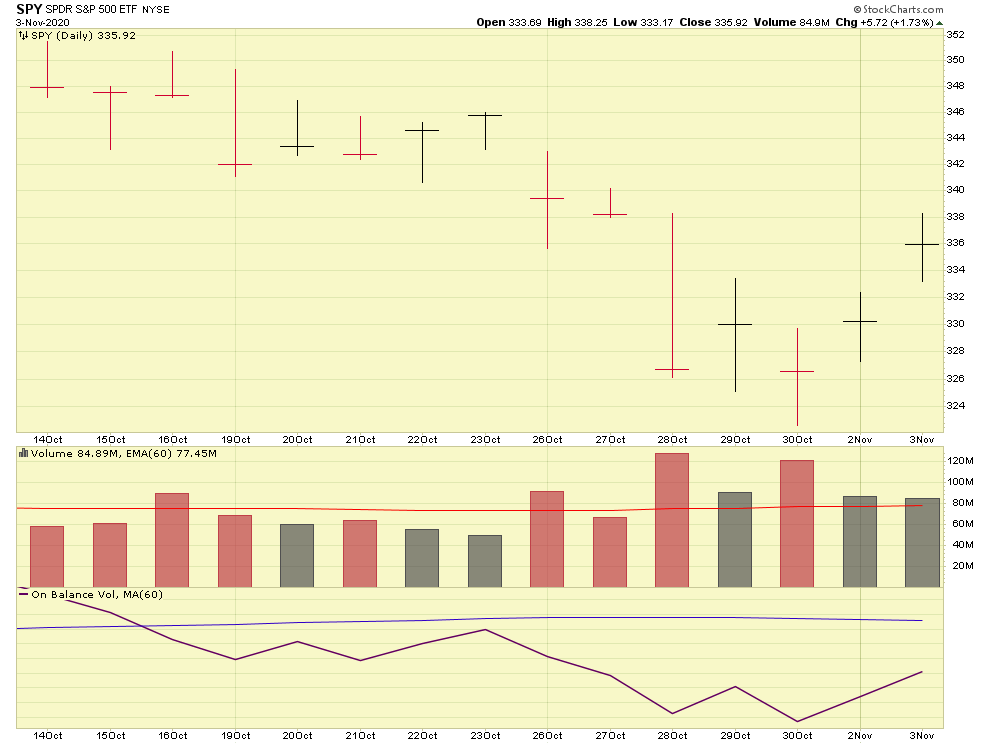
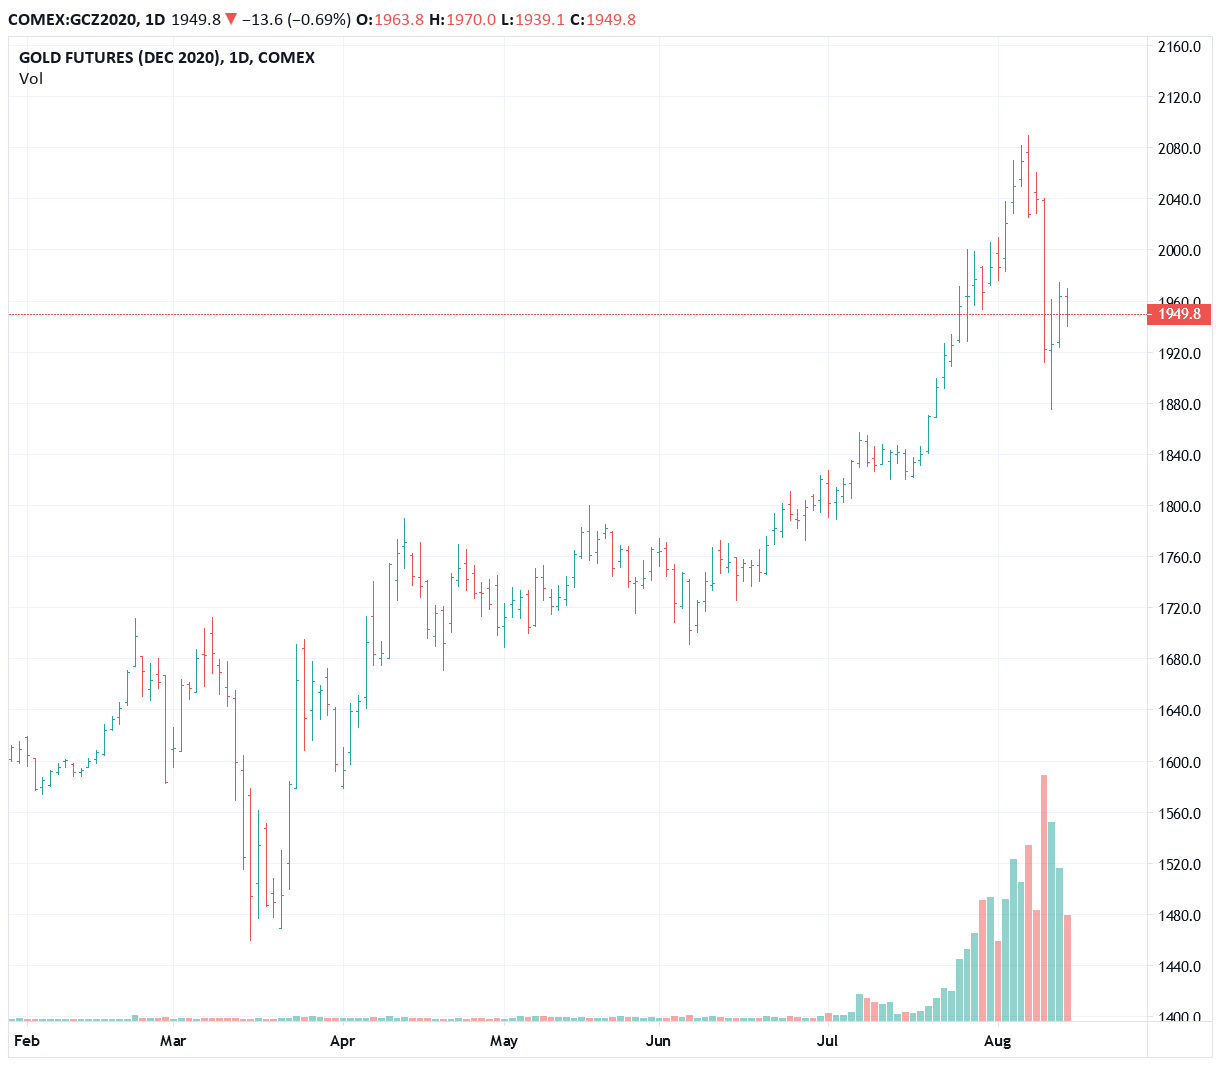
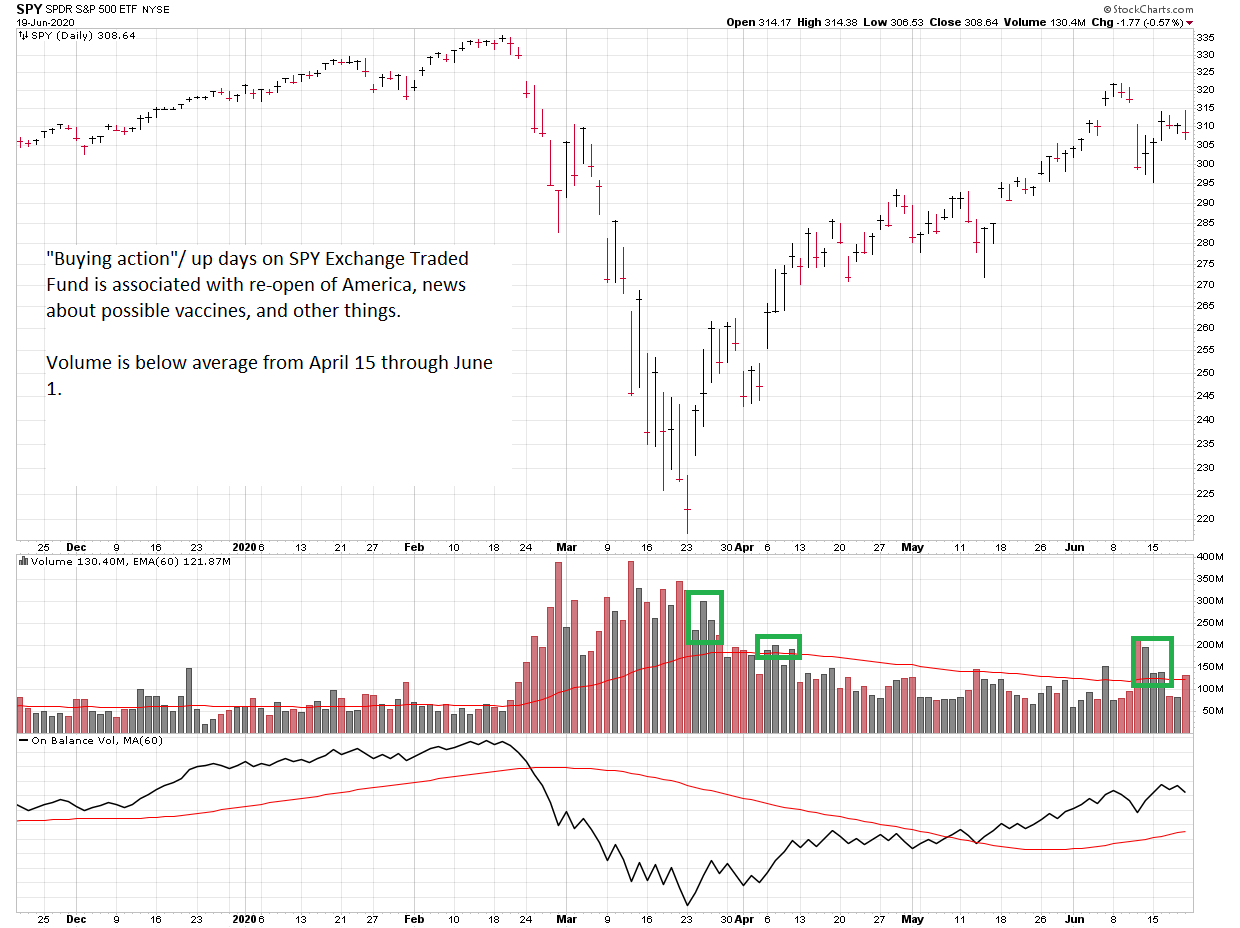
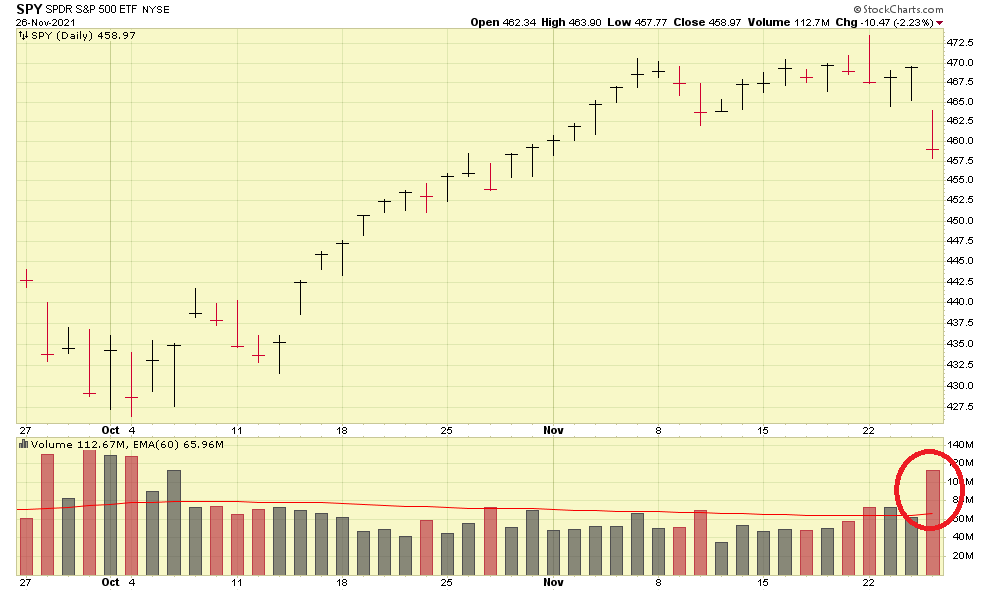
Using the Exchange Traded Funds of SPY to monitor C-Fund, and IWM to monitor S-Fund, both witnessed trading volume of 70-90% above their average volumes. Additionally, Gold traded higher on Friday, indicating a flight to safety. So how will Monday November 29, and subsequent days, react? Again, that is a crystal ball but if more negative news develops on the new COVID variant, I believe the markets may continue down. As seen below, the volume on Friday for the SPY ETF indeed was much higher than average.
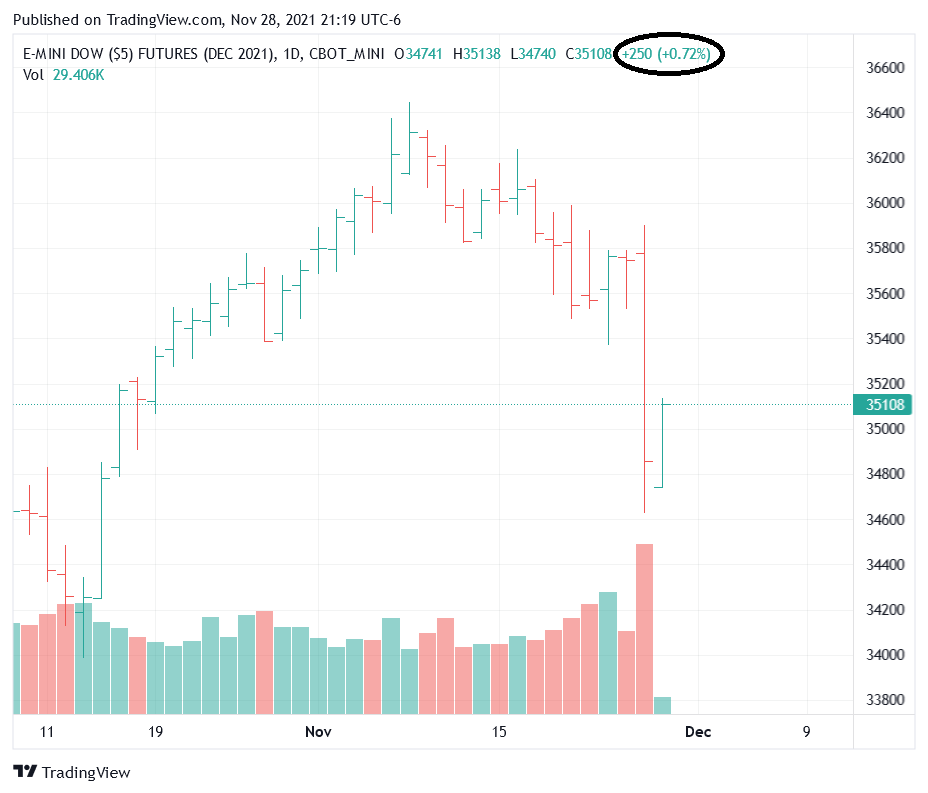
The coming days will likely determine which direction the market will go next. Hopefully Friday’s panic does not continue. Dow Jones futures for the evening of Sunday Nov 28 are reflect them trading up almost 250 points:
As stated before, my opinion is that 75% G-Fund, 25% C-Fund represents a good allocation in light of ongoing inflationary and COVID concerns. My opinion is heavy I-Fund exposure may result in undesirable negative impact from any “new variant” COVID concerns.
Additional comment: I have received some questions about “market timing” and why not just “buy and hold.” I respect everyone’s opinion, however instead of typing out a response, allow me to direct you to a 2019 post addressing this topic, at this link: http://www.thefedtrader.com/positive-signs-continue-for-the-markets/
Begin reading about halfway down the post in which I discuss market timing, the G-Fund, and the fact that the TSP website itself (not me…) advocates the use of the G-Fund to protect against losses. To quote from the US government TSP website: Consider investing in the G Fund if you would like to have all or a portion of your TSP account completely protected from loss.
Interestingly, one website existed, of course with no obvious ownership identity or human name behind it, let’s just say the word “allocation” was in the website name, well that website is no longer working and the last update prior to going out of service was sometime in 2019. Be careful who you listen to folks. The only people I personally would follow for TSP commentary would be me, Dan Jamison, and Chris Barfield. All “real humans” and actual participants in the TSP system, with “real skin” in the game. I am not a CPA, have no planning or tax expertise (nor claim to have it) so you will not find that here. My passion is market analysis. With over 7,000+ mutual funds in existence, per Money Magazine , indeed there are a variety of ways to pursue investment returns and analyze the market’s moves. Some are better than others, some are worse than others. For every guy that tells me “gee, I could have made more money by not being in G-Fund” is a guy who says “golly jeepers, I sure feel safe in G-Fund.” What you see here is my method. If you find it useful or informative, please share this website with your friends and colleagues.
Thanks for reading and talk to you soon….
Bill Pritchard