June 20 Update – Uptrend resumes but challenges Remain


Hello Folks

Bottom Line Up Front:  Markets resume an uptrend while facing numerous challenges ahead.   The following reflects my opinion based analysis of the market’s behavior in recent weeks.

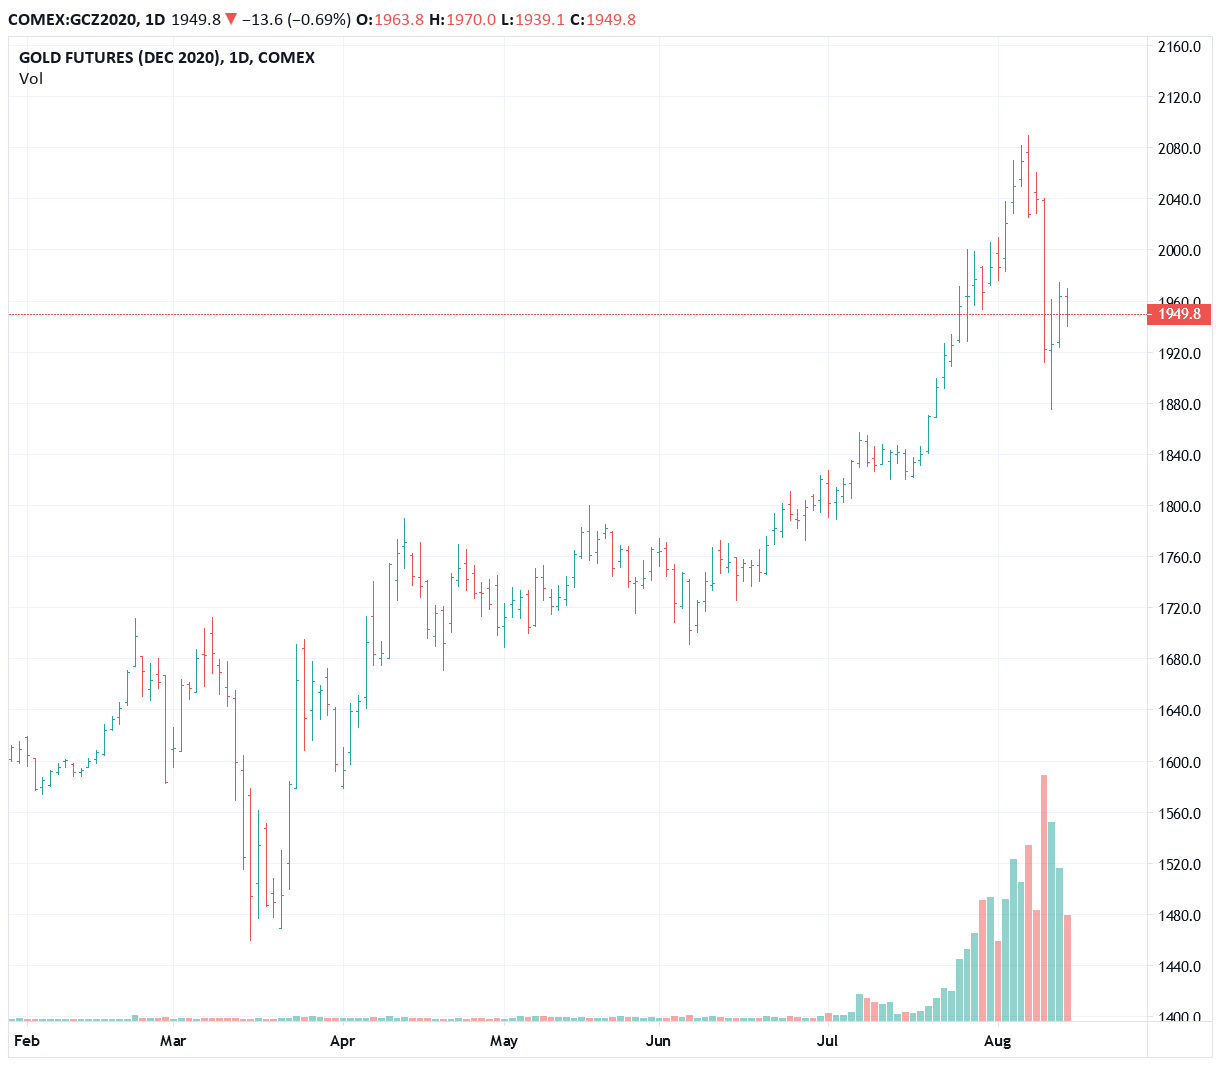
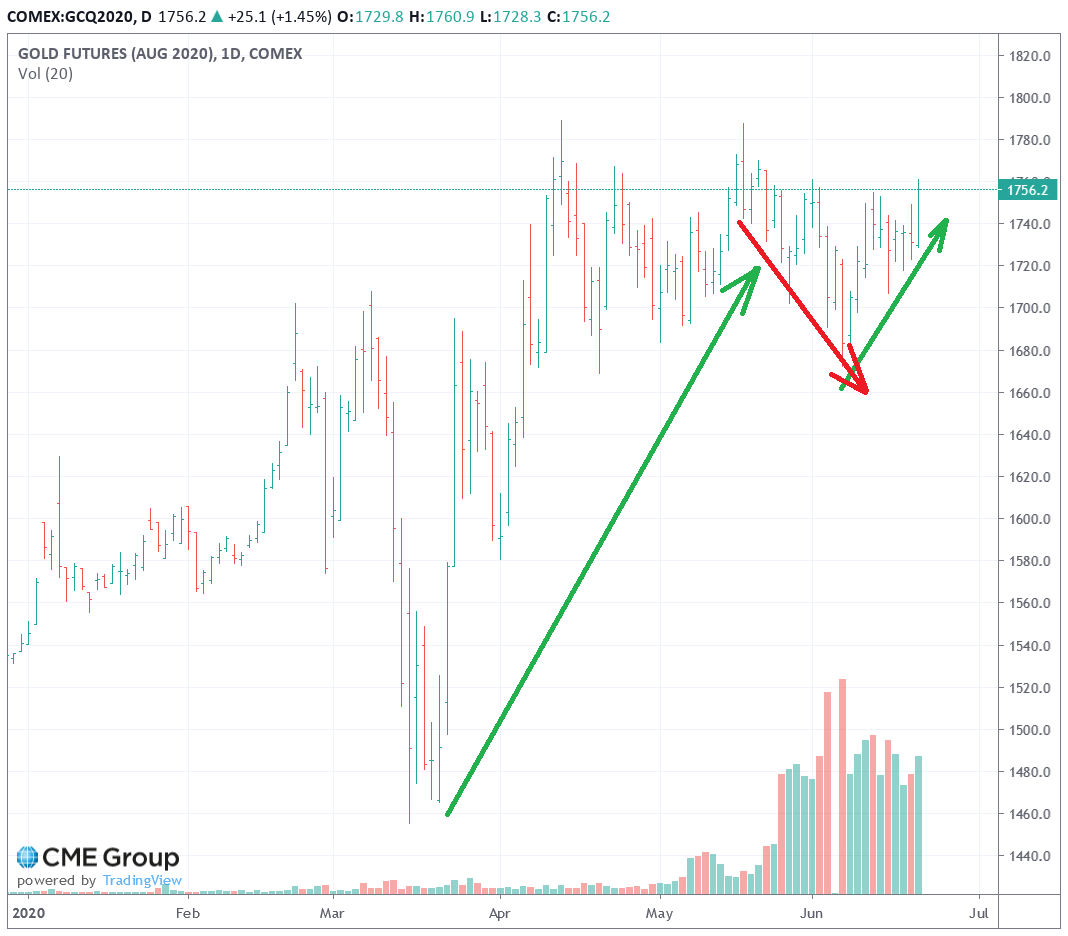
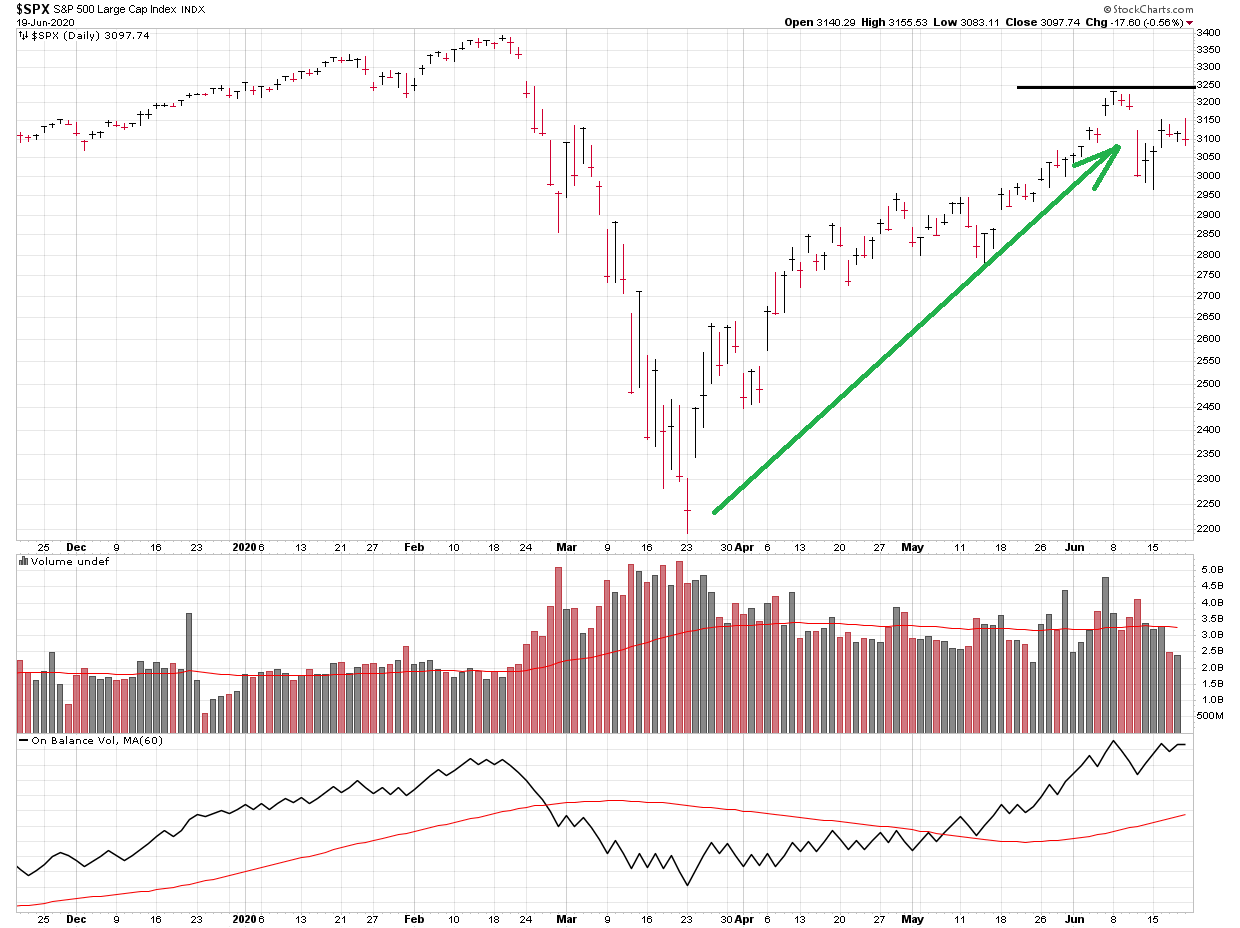
As many market watchers have observed, the markets have resumed an upward direction since approximately April 23, which coincides with various “reopening” activity across the country.  This indeed is a good thing, however the volume behind the move upward has been lackluster (in my eyes), which tells me that institutional conviction is still largely on the sidelines.   Furthermore, the price of Gold, a typical “safe haven” investment, is also up.  This tells me that the investing universe is still not fully committed to stocks/equities, even in light of the reopen of the world.  The S&P 500 index has approached its late February highs, but is encountering resistance at the 3250 area on the index.

Please see charts of Gold and the S&P 500 Index below:

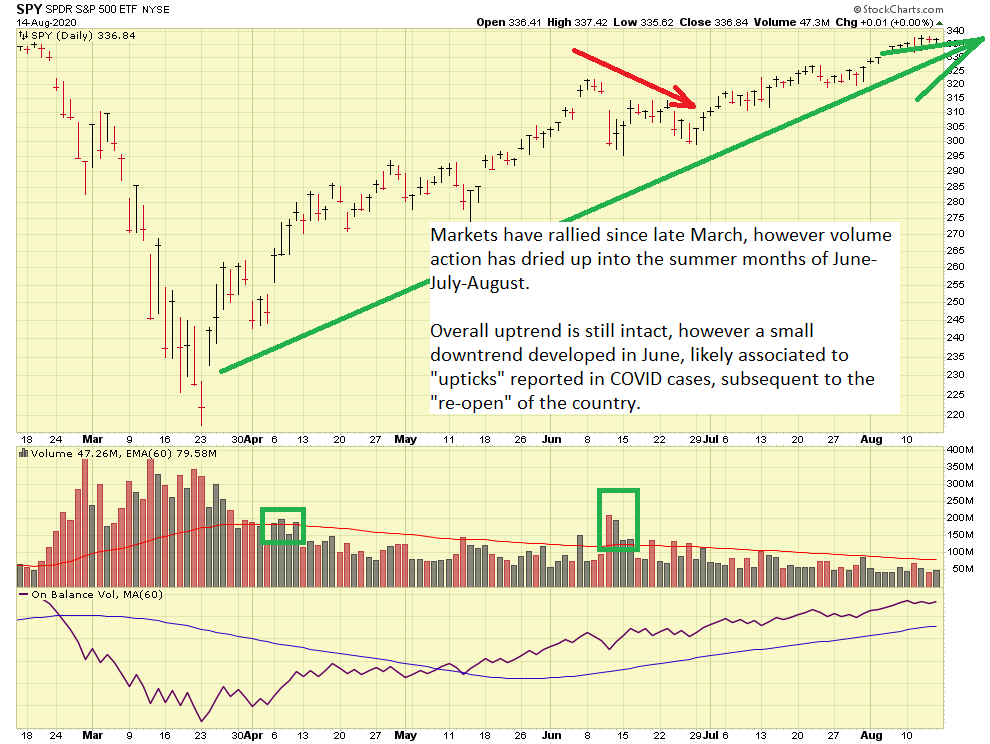
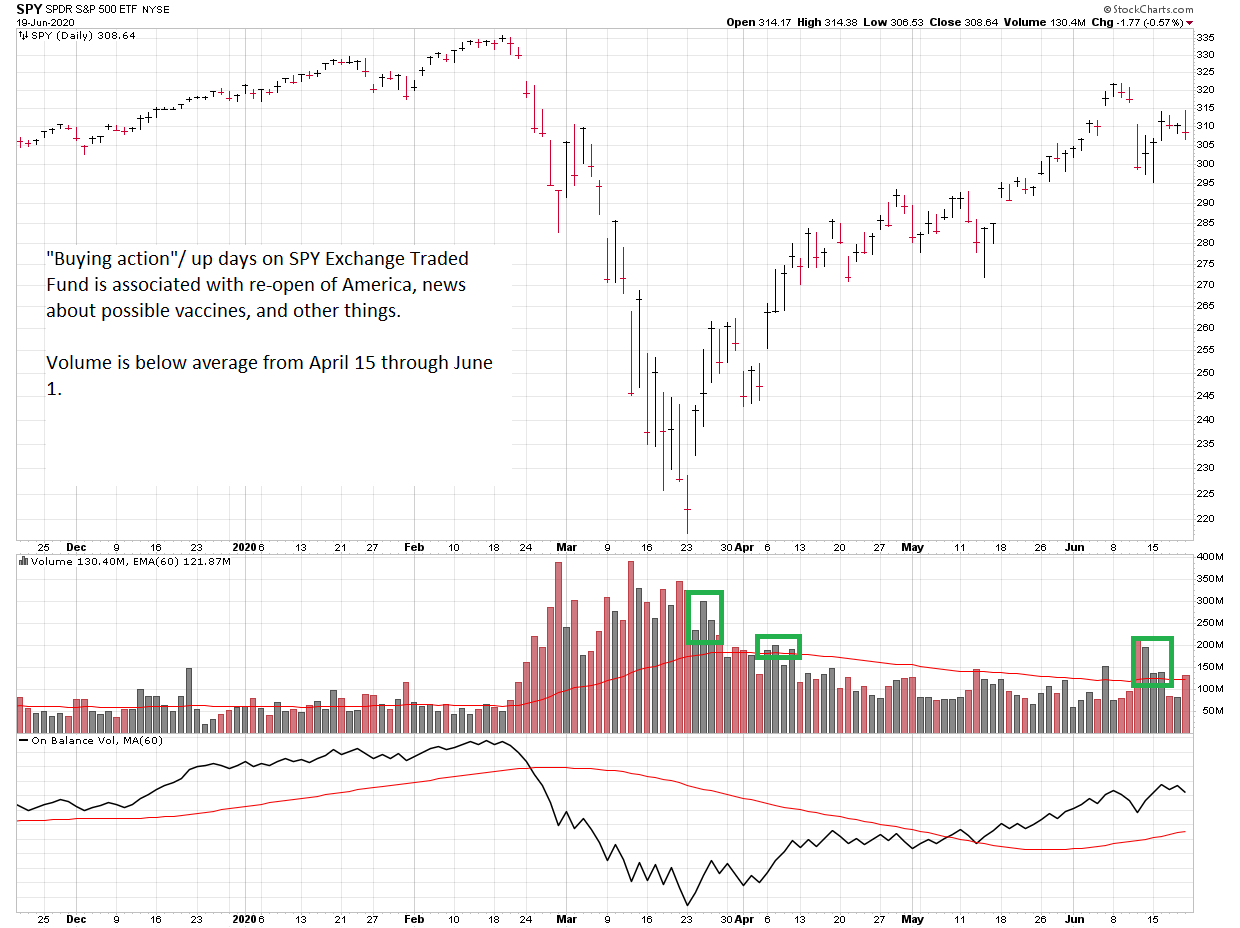
To analyze volume action, I typically employ the SPY ETF “tracking stock” which mirrors movement of the S&P 500 index.  That chart is below:

Apparent in the chart are volume spikes, coinciding with reopening announcements, and on purported good news on the vaccine front.  While welcome events, the market still has numerous hurdles ahead.

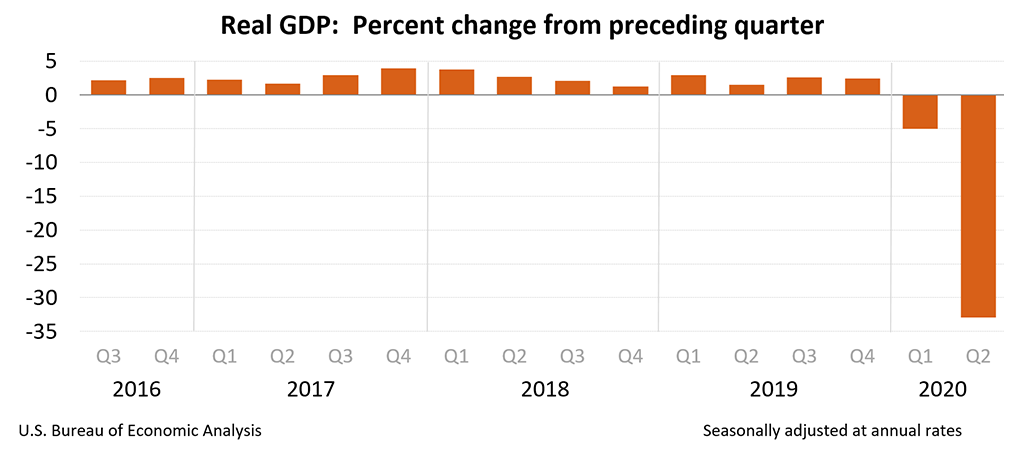
On June 8, the National Bureau of Economic Research (NBER) declared the US economy officially to be in a recession, based on the huge declines in employment and in production.  Other groups classify a recession as two consecutive quarters, or more, of negative GDP.   Our last GDP report on April 29 was -4.8%.  The next report is expected to be released on July 30.  If this is negative, then by all measures, the economy is in a recession.   Interesting factoid is that William McKinley (deceased in 1901) was the last US President to win a re-election after a recession occurred during his first term.   No President since has repeated that.  What this means is political instability later this year may be another threat to the markets.

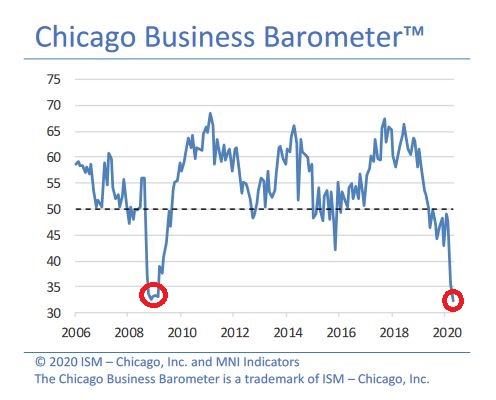
In addition to declining GDP, another barometer for the economy is the Chicago Business Barometer, summarizing current business activity, which is also known as the Chicago Purchasing Manager Index or Chicago PMI. The Barometer is considered to be a leading indicator of the USA economy.  A recent chart of this barometer reveals that the current 32.3 level is on par with 2008-2009, a period of one of the worst economic downturns of the United States.  Chart:

So we have two indicators, GDP, and Chicago Business Barometer, painting a stark picture of the economy.   Additional action in the form of stimulus and tax cuts may be warranted, however with the Senate out until July 20, this may not happen for many weeks.

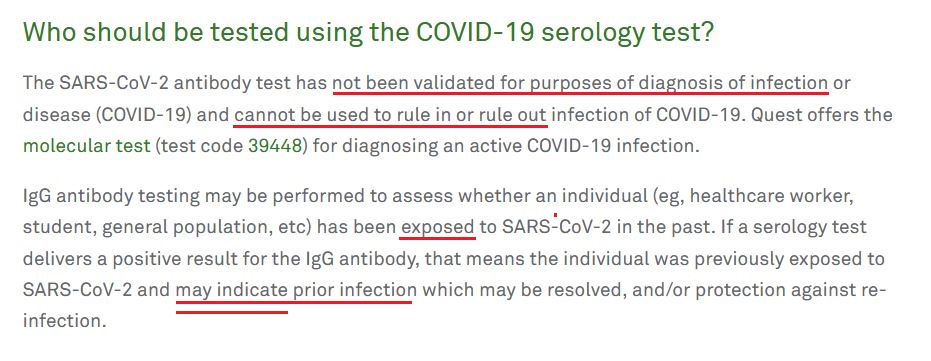
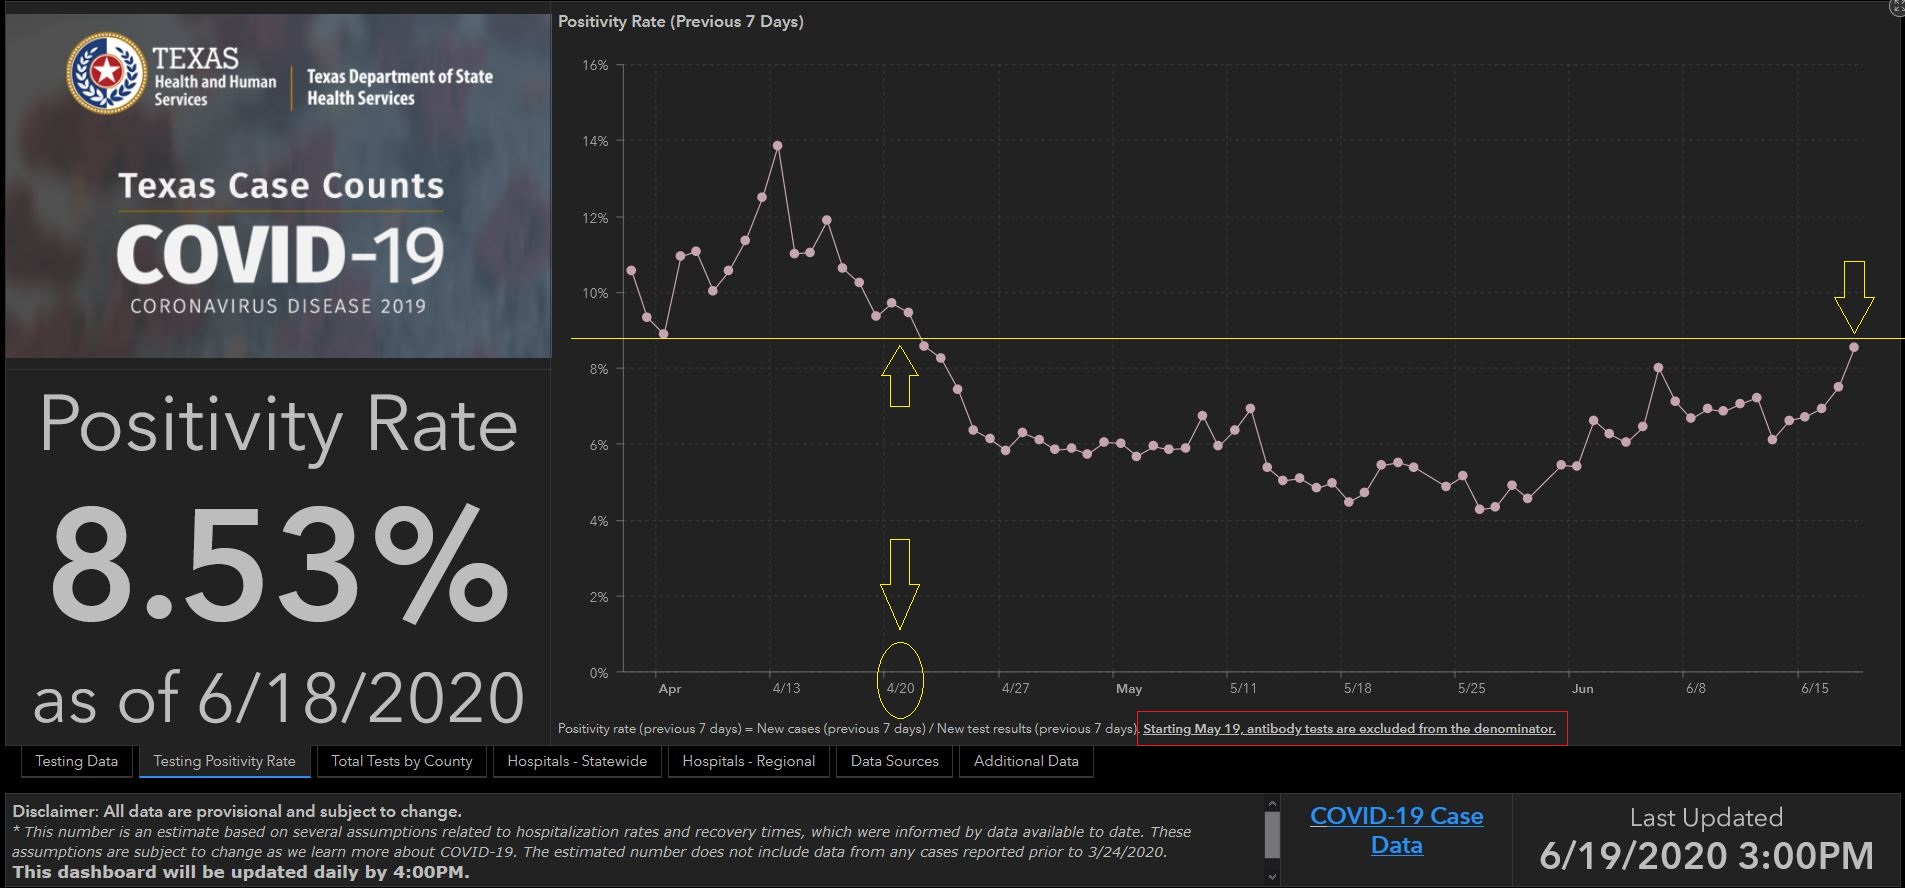
Other things threaten the markets, most notable is the Coronavirus/COVID-19 health pandemic.  I will attempt to remain apolitical here, and use my home state of Texas as a discussion point.  Texas, a conservative leaning, pro-NRA, largely Republican governed state, is the largest state of the contiguous United States, and has everything from beaches, ranch land, forests, and urban city environments.  A variety of demographics exist in regards to residents of Texas.  The way COVID is impacting Texas is probably not dissimilar to how it impacts the rest of the USA.   With that said, death counts, and the positivity rate, is increasing in Texas.  Not sure about other states, but Texas has stopped using antibody tests in the calculation of the positivity rate.  Medical experts believe the viral test (nose/throat swab) is the best test for detecting current victims.  The antibody test, merely checks for antibodies and proteins in your blood which may exist because of exposure to the virus.  Ostensibly, one may be exposed, you body fights it off, and you never got infected at all.   Should we lump this into the case counts ?   I believe some states are indeed doing this, with the media not helping as they amplify and enflame the facts.  Quest Labs themselves disclaims the use of their very own test for the purpose of ruling out COVID-19 infection:

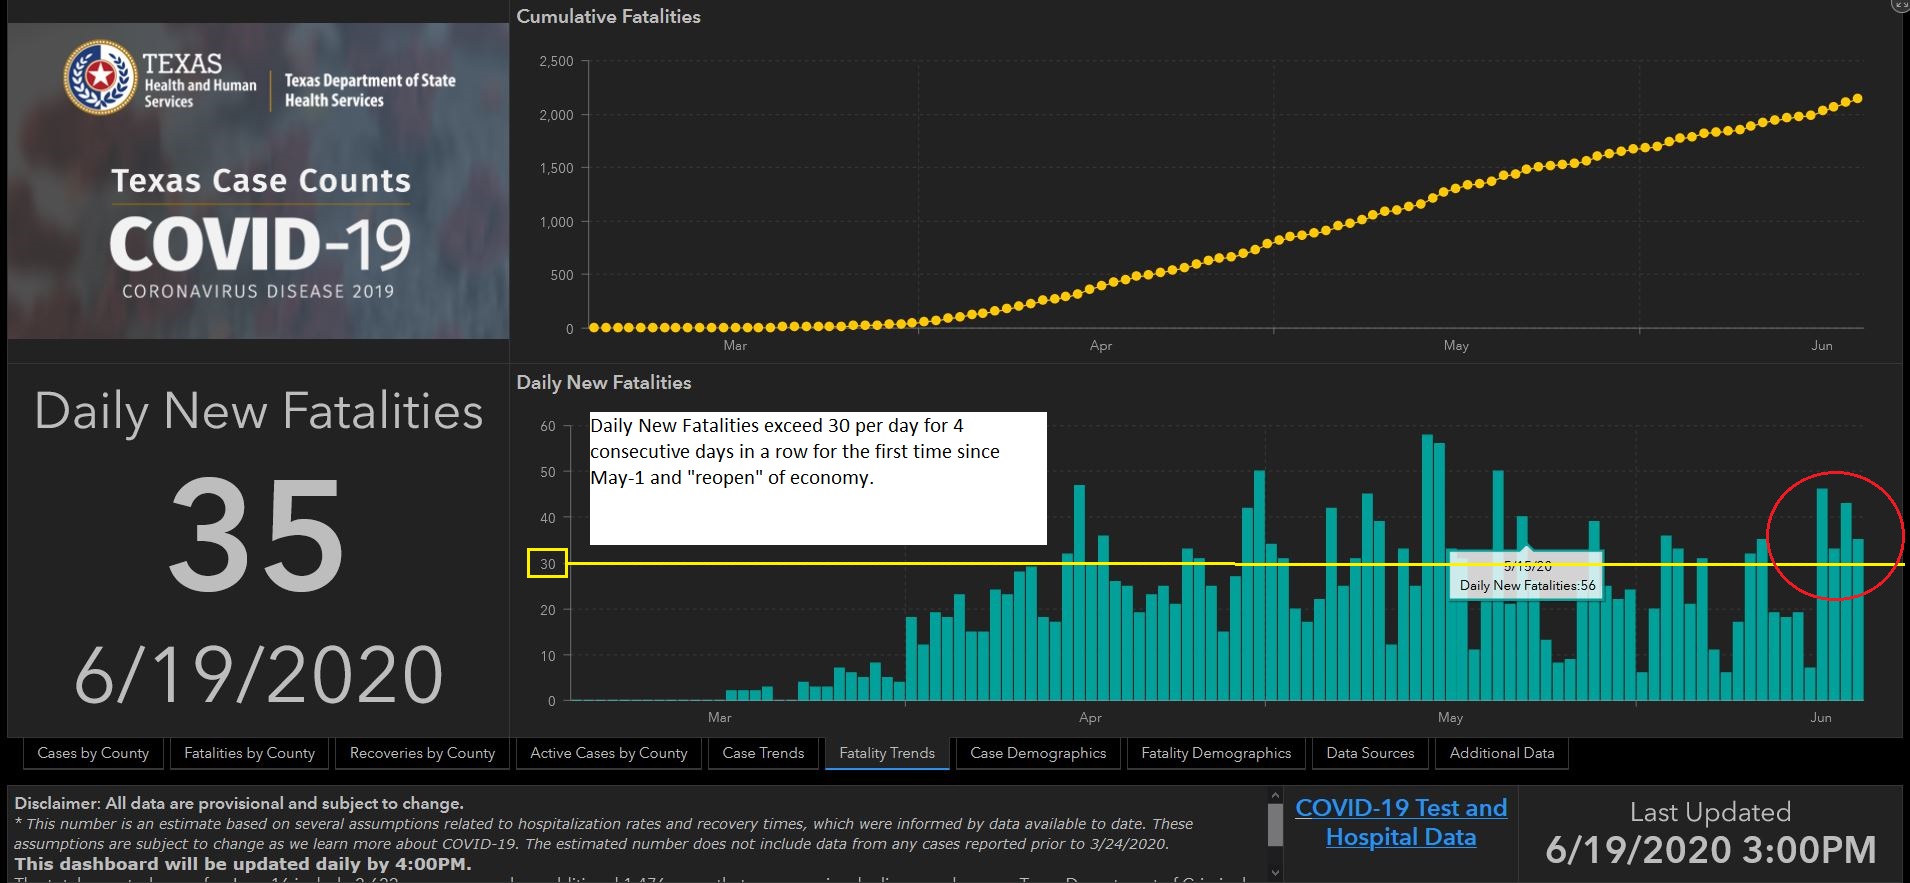
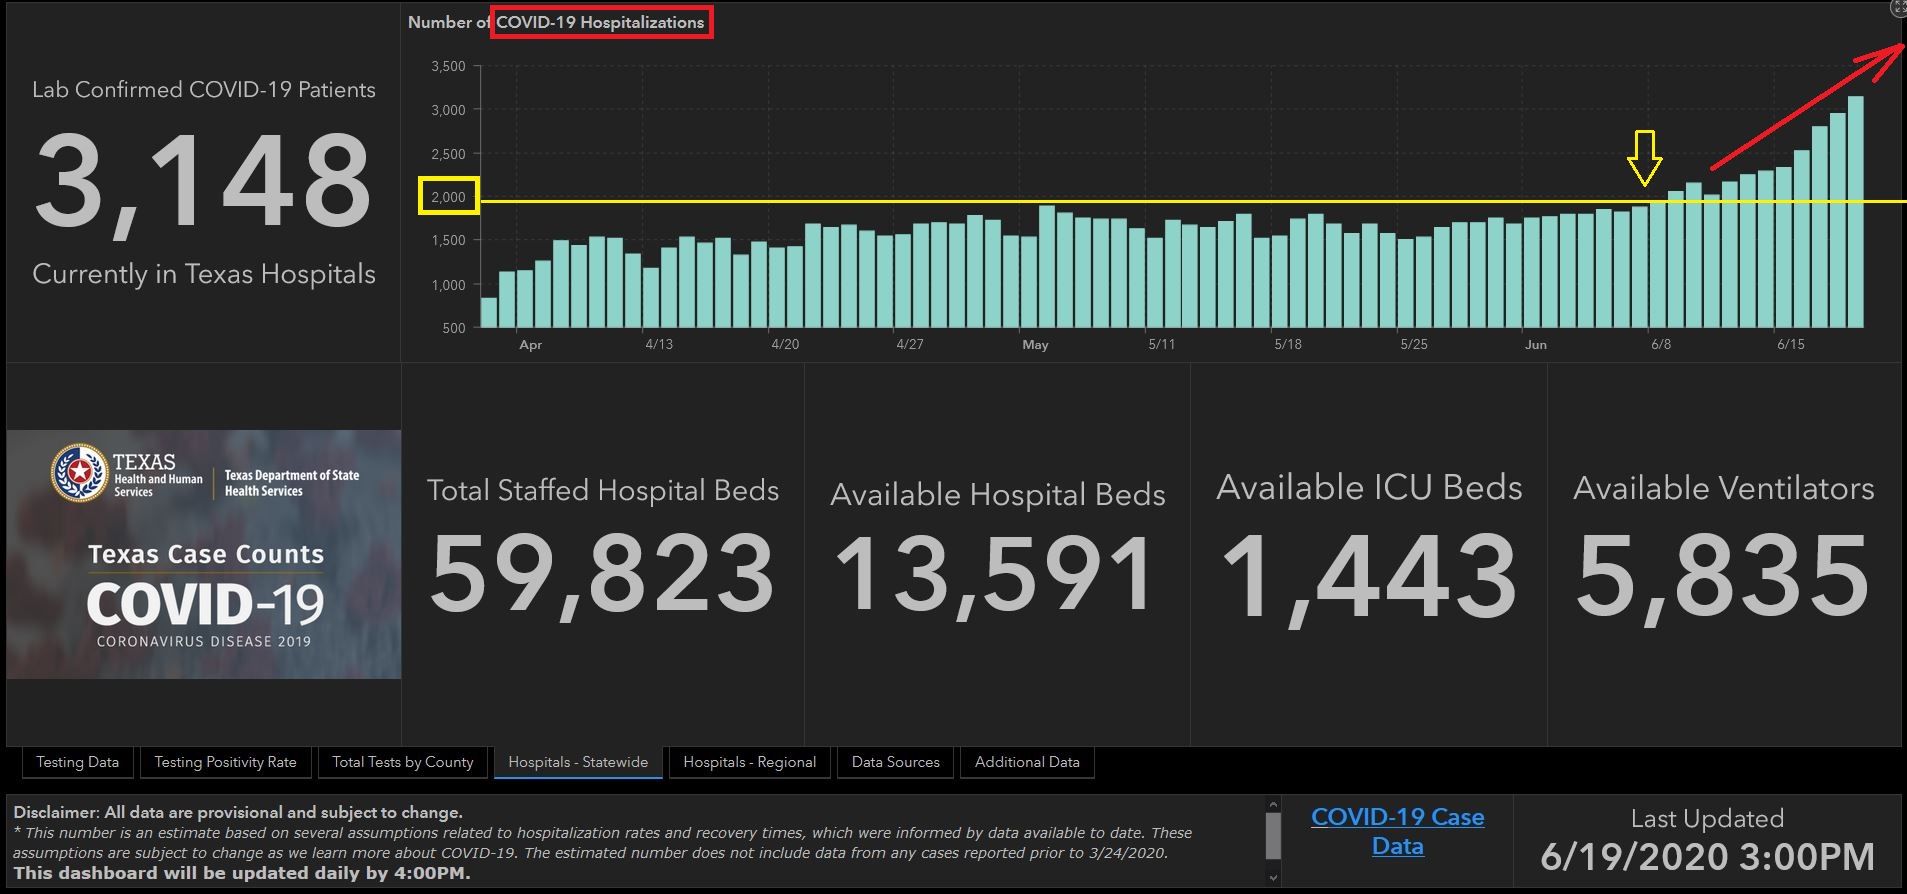
Some images from the Texas Department of State Health Services are below:

I am using Texas because I have faith in their reporting, there is no political angle to “spin” the reporting against the current administration, and they have removed antibody testing from the case counts.  If anything, they have a possible tendency to “present” the information in a favorable manner.  With that said, death numbers have increased, as has the positivity rate.

What does this mean?   It means (in my non-medical opinion) that obviously COVID continues to infect others, even in light of social distancing, mask usage, and other measures.  Big picture, this may result in restaurant closures, or another “shut down” either officially declared, or self-imposed, by the consumer.   This will impact the economy, and the stock market.  As we “re-open America”, we are likely to see increased infection rates.   The goal is minimize impact on hospital resources, but if more people get infected, the need for hospital resources only grows.  Fun fact:  We don’t need ICUs or ventilators if nobody is infected. 

In summary, the market is uptrending, but some challenges await ahead.  Some big dates ahead include the “jobs report” on July 2, the return of the Senate to Washington DC on July 20, and the 2nd Quarter GDP report on July 30.  When the Senate returns, we may see additional stimulus and economic measures which may benefit the markets.

Presently, the S-Fund is outperforming the C-Fund.   Participants may want to consider this when making allocation decisions.  My allocation of 75% G-Fund and 25% C-Fund, similar to an L-Fund, has provided me with the ideal risk/reward comfort level for the present time.

That is all for now.  If you find this free site to be informative, please share them with your friends and colleagues.  To subscribe, please use this link. 

Thank you for reading !  I hope everyone has a great weekend and Father’s Day.

-Bill Pritchard


Hope and stimulus triggers Bounceback


The stock indexes have entered May on negative footing, the Dow Jones index trading 600 points to the negative on the first day of the month of May, with the losses on April 30 (Thursday) and May 1 (Friday) effectively erasing all gains during the week.  Indeed, the last few weeks have been quite turbulent, with the market largely rebounding from the lows witnessed on March 23, 2020.   This rebound has largely resulted from hope and stimulus and not on positive economic news, which is quite lacking.  I will discuss all of the above.  Unfortunately, the damage done by Coronavirus/COVID-19 has resulted in a negative TSP performance for all stock funds, both for the last 12 months, and Year to Date.   My personal TSP Allocation of 75% G-Fund, and 25% C-Fund appears, in my opinion, to be the appropriate allocation for my account, offering me the ability to benefit from the “up days” in the market while still having some G-Fund protection.   My allocation is very similar to the TSP L-Funds.  For additional information on diversification, please visit the TSP site at: https://www.tsp.gov/PlanningTools/InvestmentStrategy/beforeyouinvest/diversification.html

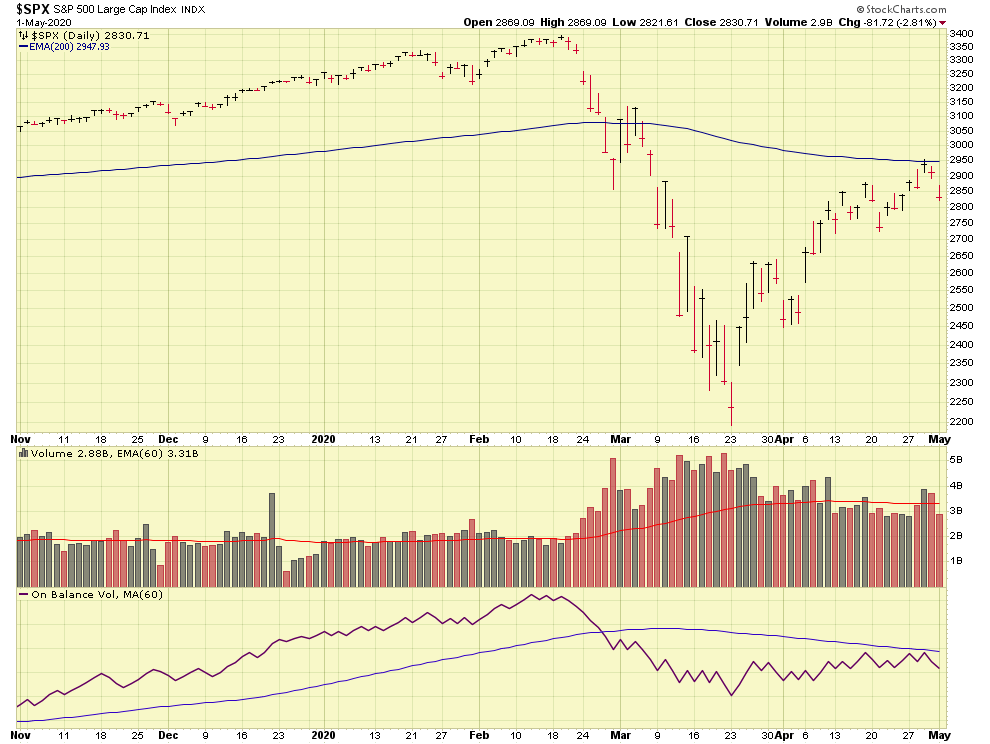
Lets take a look at the S&P 500 Index:

Evident in the chart is the rebound which started after March 23.  This rebound witnessed headwinds on April 30 and on May 1, impacted by negative economic news which included jobless claims and poor corporate earnings.

A variety of events have spurred this rebound, notably hope and stimulus, in the form of fiscal “bail out” styled packages from our Treasury Department. Indeed some of these packages have strings attached, and must be paid back with interest, but if the receiving company goes bankrupt and liquidates, there will be no pay-back that I can see.  Payroll protection, stimulus checks, loans and grants have been provided, and rightfully so.  Clearly our leaders are looking out for America- the COVID-19 virus itself and the resultant federal response has brought us into uncharted territory in many ways.

A variety of vaccine and drug studies are underway, to include Remdesivir, a product used to treat Ebola, that first came into existence in 2009, and produced by Gilead Science, and Hydroxychloroquine, used to treat malaria and Lupus.  These medicines appear to expedite the victim’s “return to service” and recovery, but do not appear to have vaccine properties or other preventative properties.   They are possible treatment drugs. Remdesivir requires intravenous injection, aka IV-bag and hospital bed, etc.  It does not align with mass applications to thousands of people in one setting. Hydroxychloroquine can be administered via a tablet.  These drugs, and others, have provided people with hope, a necessary and desirable thing to have in times of despair and uncertainty.

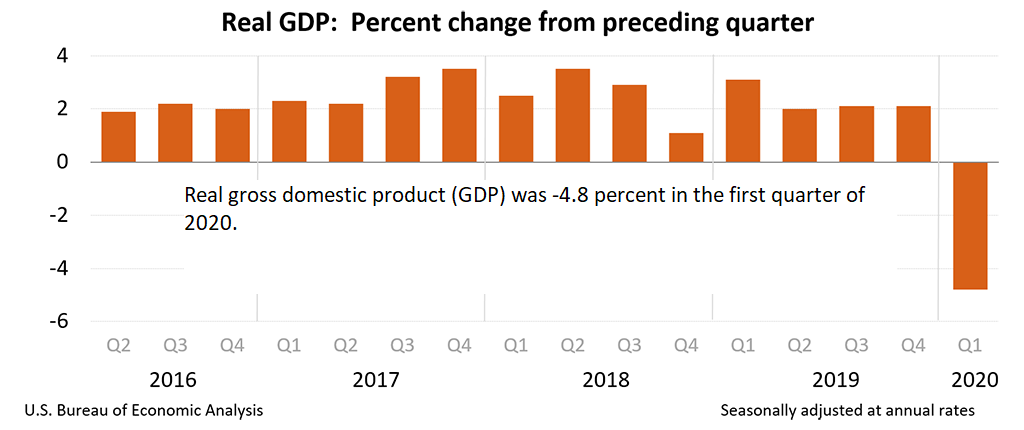
On the economic front, news is not good.  Let me be clear:  there are no fundamental/economic-based news to send the market higher.  The April 29 Gross Domestic Product (GDP) release reflects that GDP decreased -4.8 percent in the first quarter of 2020, according to the “advance” estimate released by the Bureau of Economic Analysis:

In the event that next quarter’s GDP is negative, that will reflect the “official” start of a recession, which is a GDP decline in two consecutive quarters.  Many economists are already saying a recession is here now, akin to a Category 5 hurricane offshore and declaring the beach house “destroyed”, even before the Hurricane arrives.  In any event, next quarter’s GDP will be telling.  Additional negative news includes 30 million jobless claimed filed in the last six weeks, and a reduction of housing market optimism as reflected in the Housing Market Index, a monthly poll of builders and construction professionals.

So what is going on with COVID, which caused this mayhem?  Most experts agree that our economy was fine until COVID came along.  COVID statistics and metrics are probably the most polarizing topic in modern times, aside from talking about religion and politics itself.   How are death rates calculated ?  Do people die of COPD, lung infections, or is it labeled “COVID?”  If the medical examiner in NYC does things one way, does the medical examiner in Seattle do it the same way ?   What about hospitalizations ?   Reports exist that hospitals “want” COVID patients, to allegedly obtain high value reimbursements from the government.  I doubt this is the case, nobody wants a walking HazMat case to coming into any building.  Hospitals can make money in a lot of other ways anyway.  Others report that this very reason is causing hospitals to turn away patients who are non-critical, thus resulting in a walk-up patient, indeed with COVID, who is sent home to recover.  This is not a “hospitalization.”  A very superficial assessment of Hospital ABC, with no COVID patients (they all got sent home at the door), will cause someone to believe that there is no COVID in that town.  Also, as testing expands across the nation, case counts will naturally increase. One could spend hours reviewing COVID data and still not understand the scope of the problem.  Sensationalist media (basically all channels besides the Food Network) does not help.

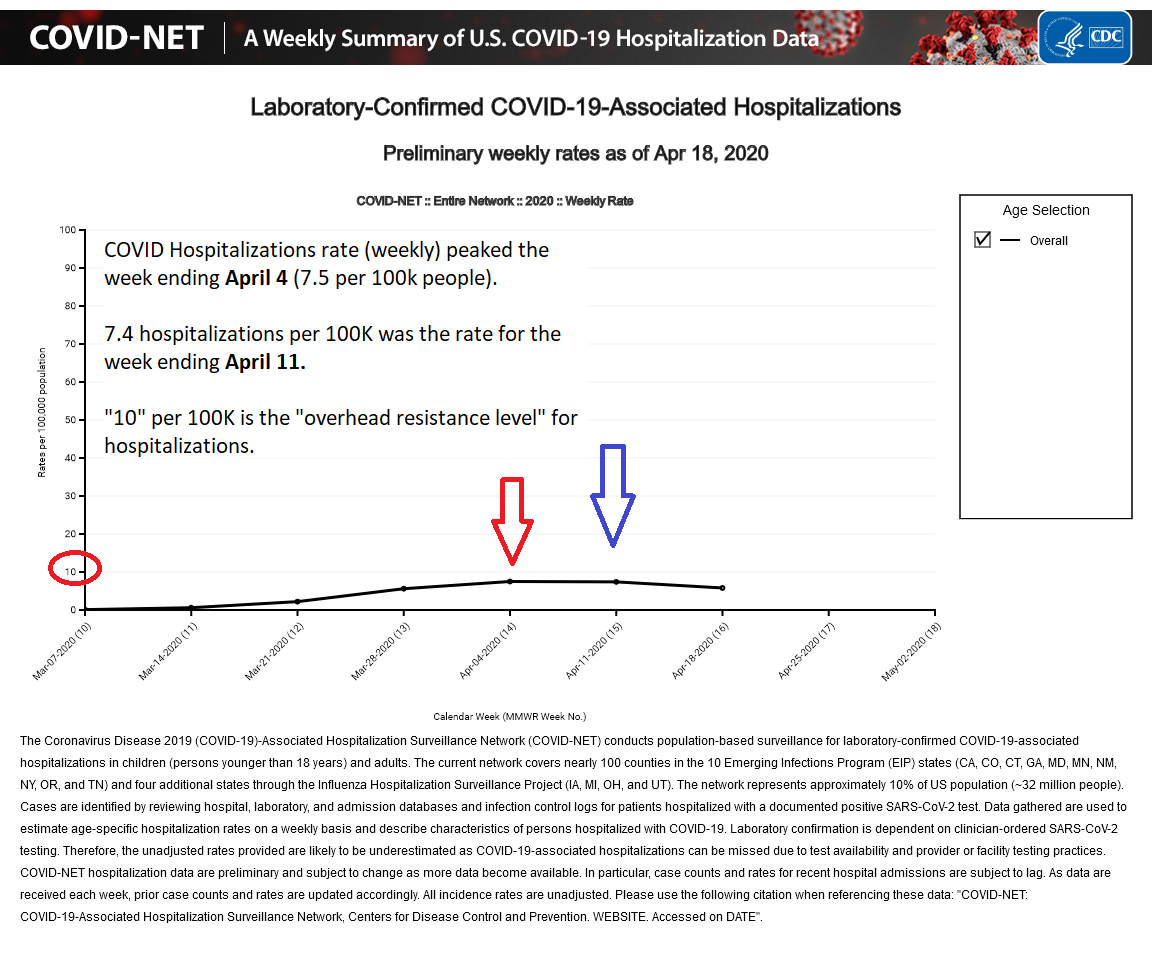
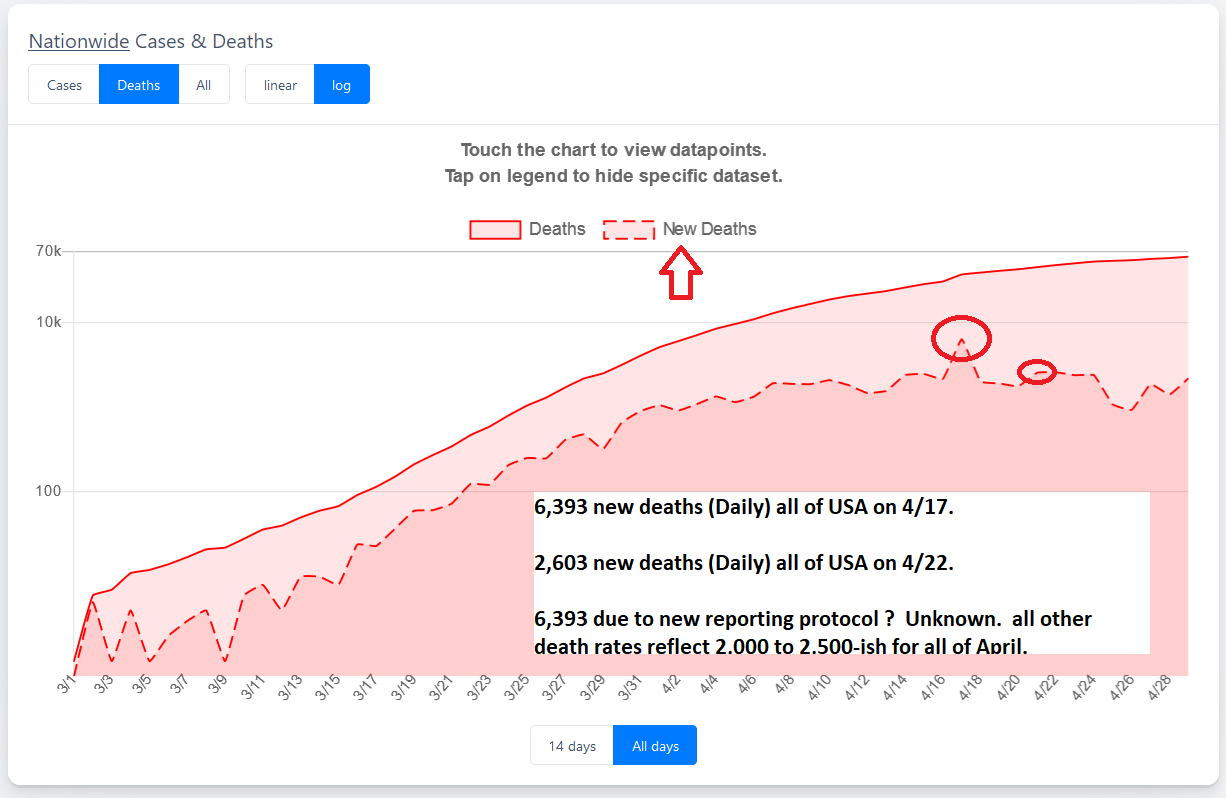
For me, all I care about is daily rates.  Not cumulative.  A graveyard is cumulative.   Today it contains 50 deceased persons.  Tomorrow, 3 graves become occupied and the graveyard now has 53 deceased.   Naturally, over time, more people fill the graveyard.  When sensationalist media claims two (2) COVID deaths in January, and 60,000 in April, well, yes, that is correct.   As people die, the numbers increase (sadly).   What I care about is daily rates, of hospitalizations, and of deaths (aforementioned date methods aside).  See charts:

For the weeks ending on April 4 and April 11, the weekly hospitalization rate (there is no daily rate from CDC) was 7.5 and 7.4 persons per 100,000 people.    We obviously do not want that to increase.  My personal “worry level” would be 10 persons per 100,000 people, as that is clearly abnormally high.    Lets move on to death rates:

Evident in the cart is the fact that the daily new death rate (for April) is basically 2,000 to 2,500 a day.  We had a spike of 2,603 a day on April 22, and a huge spike of 6,393 on April 17.  I am not sure if the reporting criteria changed that day or what happened, but if we remove that from consideration, we are looking at 2,000 to 2,500 a day for new deaths.   My “worry level” is if we see 3,000 a day for new deaths.

Which leads to the lock-down discussion.  If we have no vaccine, no preventative medicines, and only via self-quarantine and social distancing, have we managed to reduce daily rates to the above levels, what happens when we “open back up.”  More importantly, what will the decision makers do ?   Hypothetically, lets say USA is “open” (albeit wearing masks, social distancing, etc) on June 1.   Lets say masks and other measures indeed have some positive impact. However, new infections and new deaths are still bound to happen.  Lets say we go all of June then we see hospitalizations and deaths spike in July, as a result of the May/June “re-open.”  I am not being pessimistic here but it is what it is.  School typically resumes late August.   The decision to return to school will probably be mid-August.   So in my opinion, July is a very important month.   It may set the tone for a return to school and other things.   Keep an eye on the above rates.  Elected Governors and Mayors know that you can shut down testing and magically have “No COVID cases” and high five each other that the problem is solved.  But if someone dies from COVID, or is hospitalized with COVID, that is hard to dispute.   My worry levels are 10 hospitalized per 100,000, and 3,000 deaths daily.  By the time July arrives, we should have the May and June data which will paint the picture of where COVID is headed.

Lets keep our fingers crossed as we begin the new trading month of May.  My personal TSP Allocation remains 75% G-Fund, and 25% C-Fund.

Thank you for reading, please share this email with friends and colleagues who may find my opinion based analysis of the markets useful…the link to subscribe is:  http://www.thefedtrader.com/contact-us/

Thank you

-Bill Pritchard

COVID-Crash accelerates – worst week since 2008


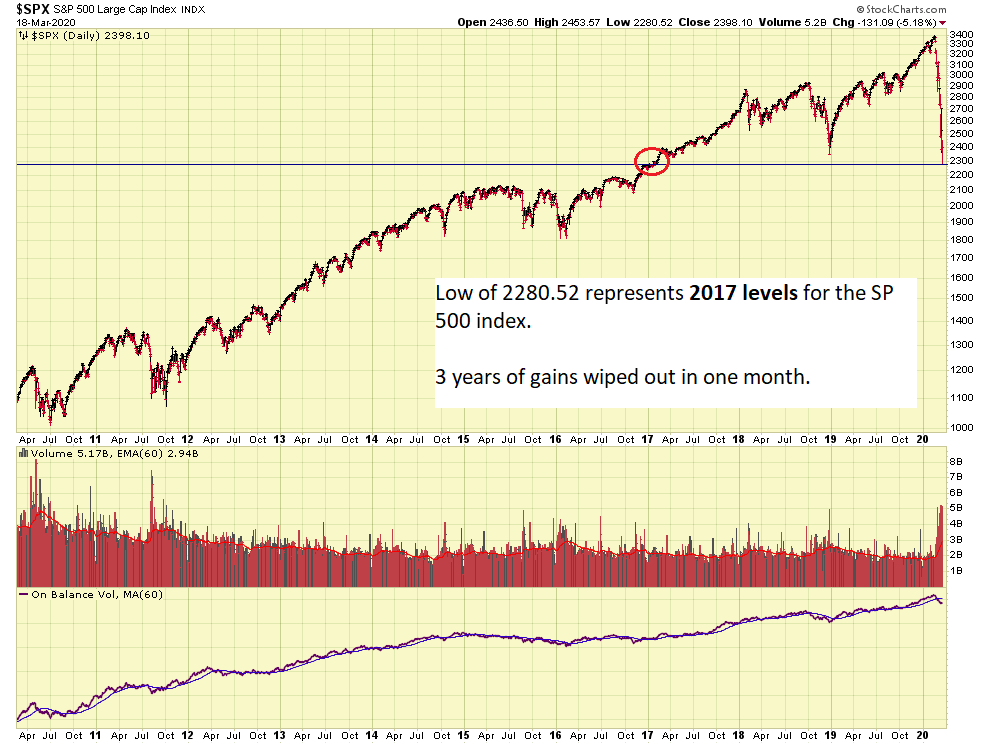
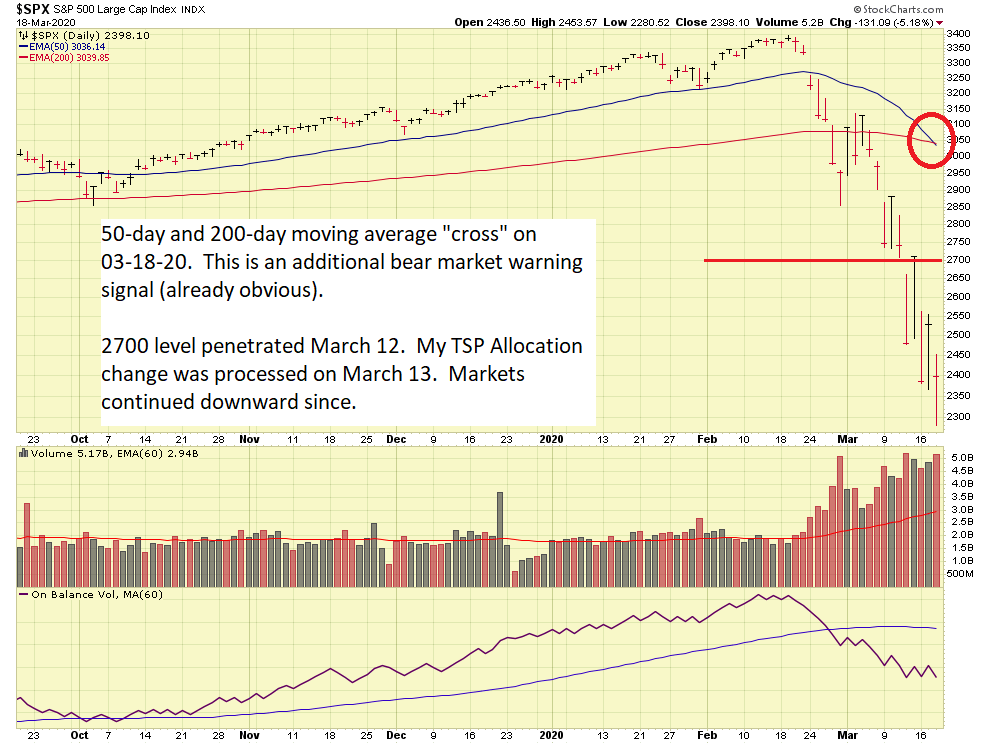
Last week, the stock markets continued their COVID-19 triggered crash, resulting in the worst week for the Dow Jones and S&P 500 indexes since 2008 (12 years ago).   You may recall that I changed my asset allocation in my TSP to 75% G-Fund, and 25% C-Fund, triggered by the deteriorating market and the penetration of 2700 on the S&P 500, resulting in a “official” bear market status.  In mere weeks, the indexes have given up ALL gains from 2018 and 2019.  ALL of them.

Plainly visible in the above charts is the penetration of 2700, resulting in an “official” bear market (20% decline from an all time high), and also the cross of the 50-day and 200-day moving average.  This “cross” is a very common trend identification tool, used by thousands of institutional investors.  I guarantee you that many people are watching these levels and trends, and additional selling will soon follow in the future.

As previously mentioned in my FAQ, major market trends, to include Bull and Bear cycles, are driven by catalysts.  Indeed, a global virus outbreak and pandemic, can serve as a catalyst.

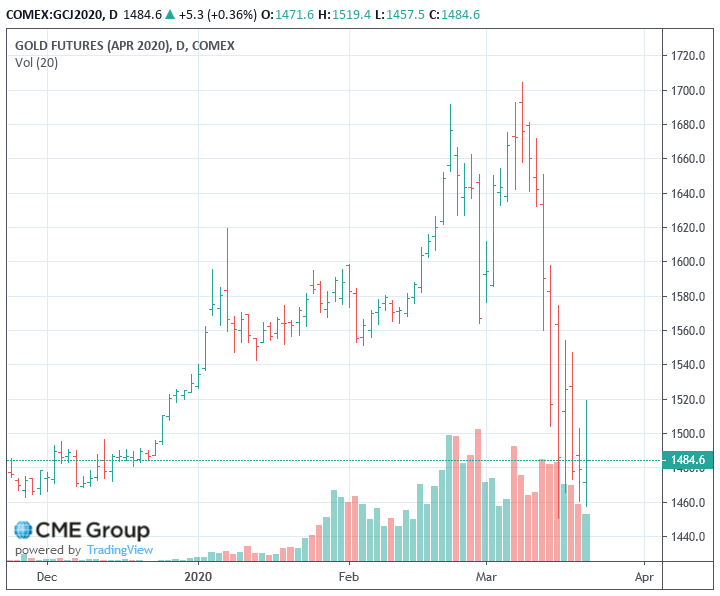
Evidence indeed exists that this is a very dangerous situation- my personal stance has changed somewhat (once presented with facts, I tend to shift my views…usually…) in recent weeks.  The world is on lock-down of varying degrees, for the first time in history, people are encouraged to not go to work, to not socialize, and to stay inside.   The global economic impact of this will be catastrophic.  It is of such proportions, that even Gold is not safe.  Investors are selling gold to raise cash, as “cash is king” right now.   See chart:

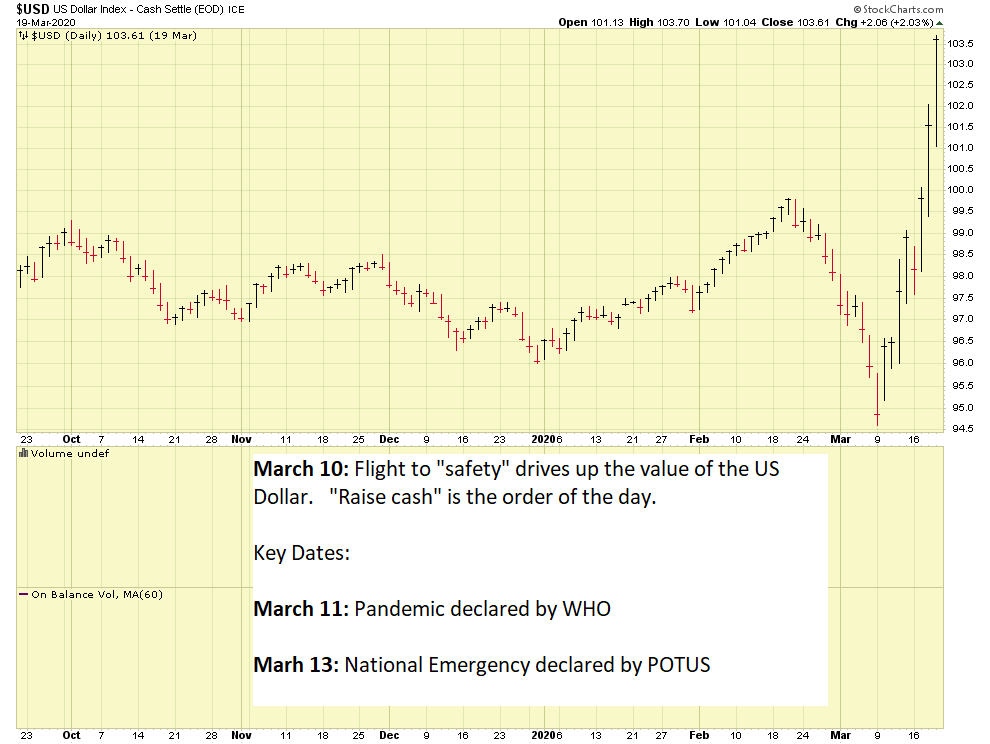
Visible above is the mini-crash going on in Gold now.   So when you squeeze the water balloon on one end, the water goes somewhere else, and makes the other end expand, does it not ?   Investors are raising cash, which is driving the “value” of the dollar higher, as indicated on the US Dollar Index chart below:

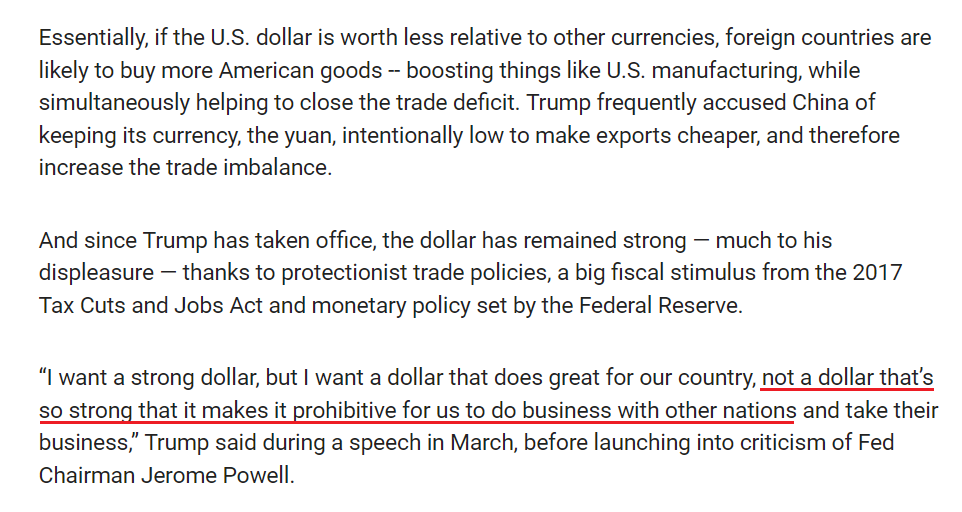
The increasing strength of the dollar, having begun on March 10,  is not desired by President Trump, who publicly has denounced a strong dollar because it impacts trade.  Fox News Business provided a 2019 article where this can be further explored: https://www.foxbusiness.com/economy/trump-weaker-us-dollar

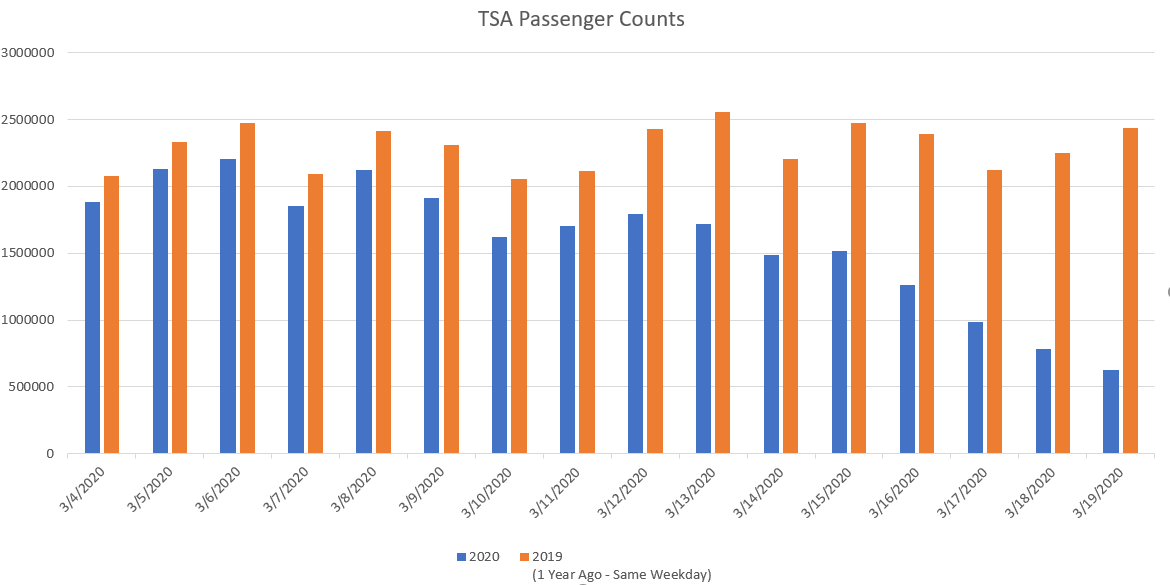
So stock market aside, there are other cracks in the foundation appearing, notably the strength of the US Dollar.  Furthermore, we still do not know the true impact of COVID-19, but preliminary figures are starting to trickle in.  For example, one sector hugely impacted is the aerospace and airline industry.  Transportation and Security Administration (TSA) checkpoint travel numbers shows that passenger counts are down 50 to 80% from the same time last year:

I imported the data into a simple Excel graphic to allow a visual depiction of things.  Passenger counts are drying up, exasperated by lock-downs and restrictions in major travel states of California (LAX, SFO) and New York (JFK, LGA).  Hawaii will soon impose 14 day quarantines for all inbound visitors. 

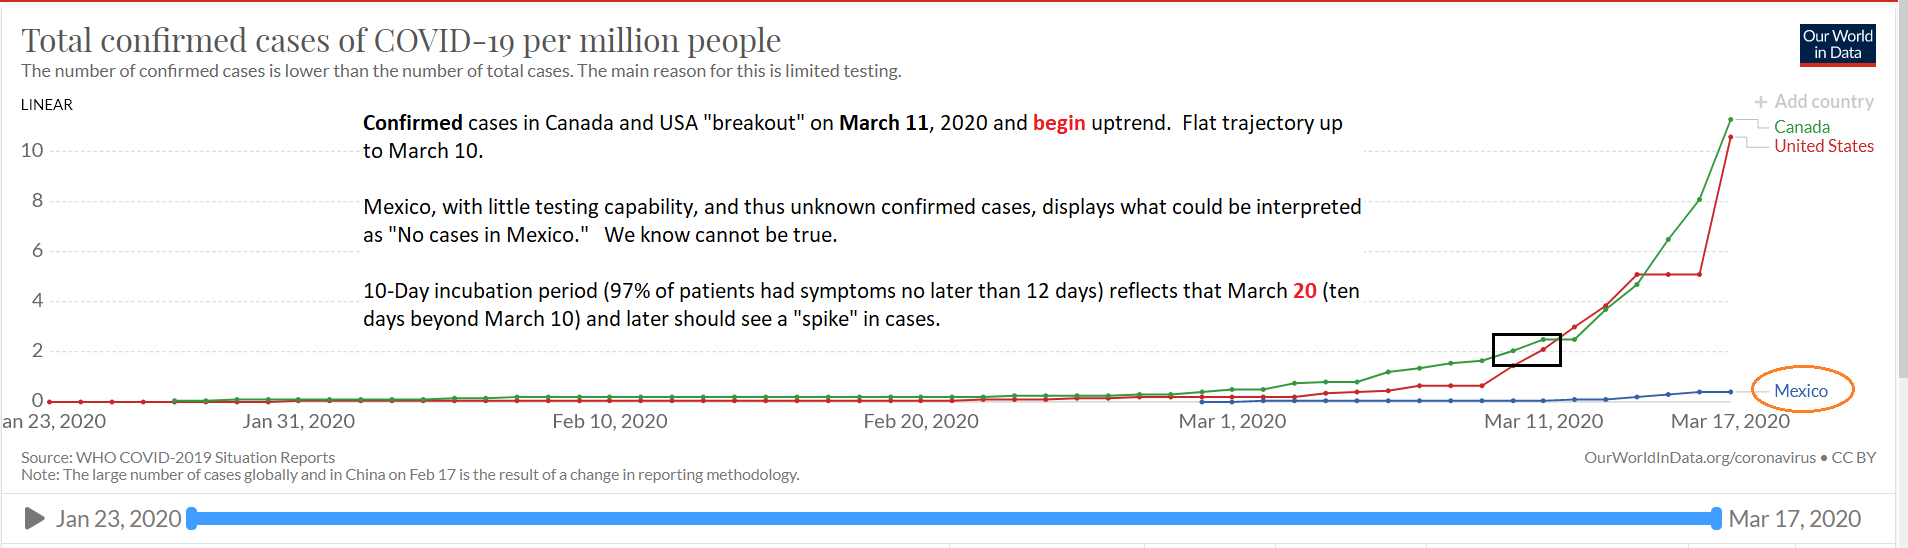
Economic talk aside, lets talk about COVID-19.   I am calling March 10, 2020 as the date that USA began to realize that COVID-19 was a threat.  The outflows to the dollar began that date (“smart money” was behind this move), the market attained Bear Market status on March 11 (no doubt driven by decisions on March 10 and prior), and a noticeable uptick in COVID cases began that date:

TSA travel date reflects a drop-off of travel starting March 7, then a clear breakdown March 10 and after.   On March 12, I inputted my asset allocation change to the TSP, and largely avoided the bloodbath which happened last week.

I will not bore you with COVID-19 charts and graphics, plenty exist on the internet.  It is sad to report that we have surpassed Spain in the number of cases.  Communist China, who kicked out reporters, and are the likely culprit for introducing this to the world, is not to be trusted for reliable reporting.   I hear people on the cable news shows state that “China does not have a problem anymore” etc.  I doubt that is the case.

As I stated in a prior post, my opinion is that reported cases for the United States will be drastically higher in April, due to the 14 day incubation period from mid-March, and due to increased (more) testing sites.  Behavior-based measures (self quarantine, social distancing, etc.) did not really begin until mid-March.   Only a few days ago did the majority of people really start to take this seriously (at least in my view).  Hence, I think it is fair to say that we are about to get a huge amount of confirmed cases in the coming weeks.

Moving on….Any federal bailout package will not be without attached strings; cash hand outs (taxpayer funded) to for-profit corporations are less likely than government loans, with qualifying requirements.  Probably every business in America will benefit from assistance.  The hospital industry alone is reportedly in need of $100 billion just to ramp up COVID-19 related capacity and infrastructure.

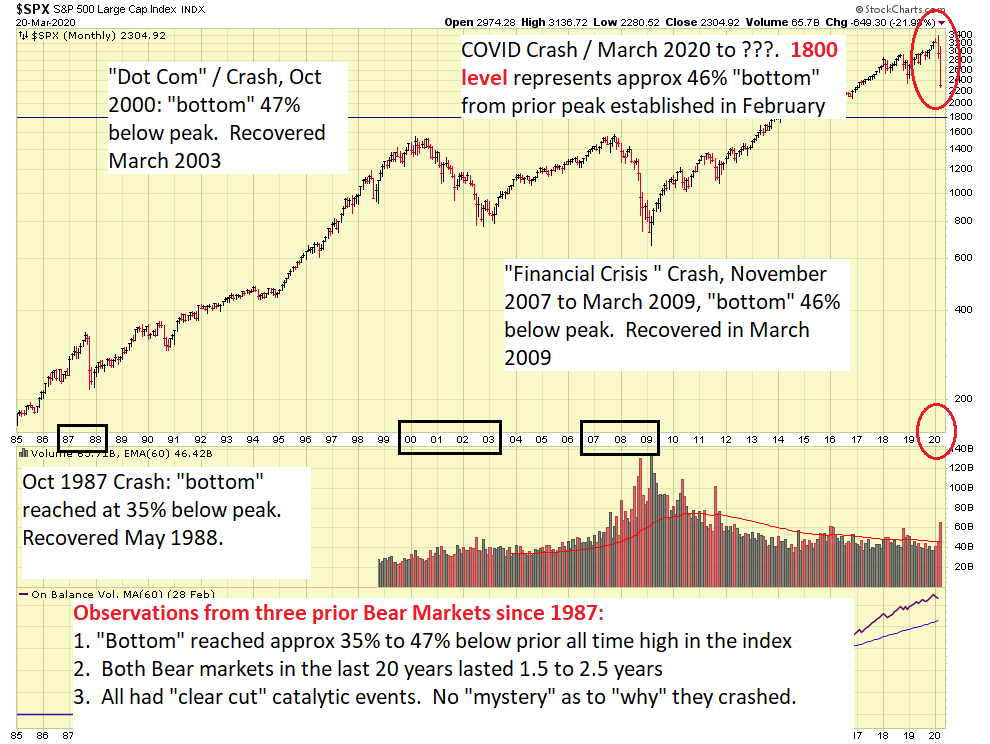
So how long will this crash/correction last ?   Attached is a chart I made of the S&P 500 index going back 30 years, with comments on the chart:

If history is any guide, the “bottom” is not going to be close until at least 35% to the downside is reached, or 2200, at the very least.   The financial crisis of 2007-2009 and the “Dot Com” bust of 2000 witnessed a decline of 47% until the “bottom” was reached.   A 47% loss today is located at the 1798 level.   We can round this up for simplicity to 1800, and keep an eye on 1800 to 2200 as a possible “bottom zone” with the assumption that history will be a reliable guide for us.

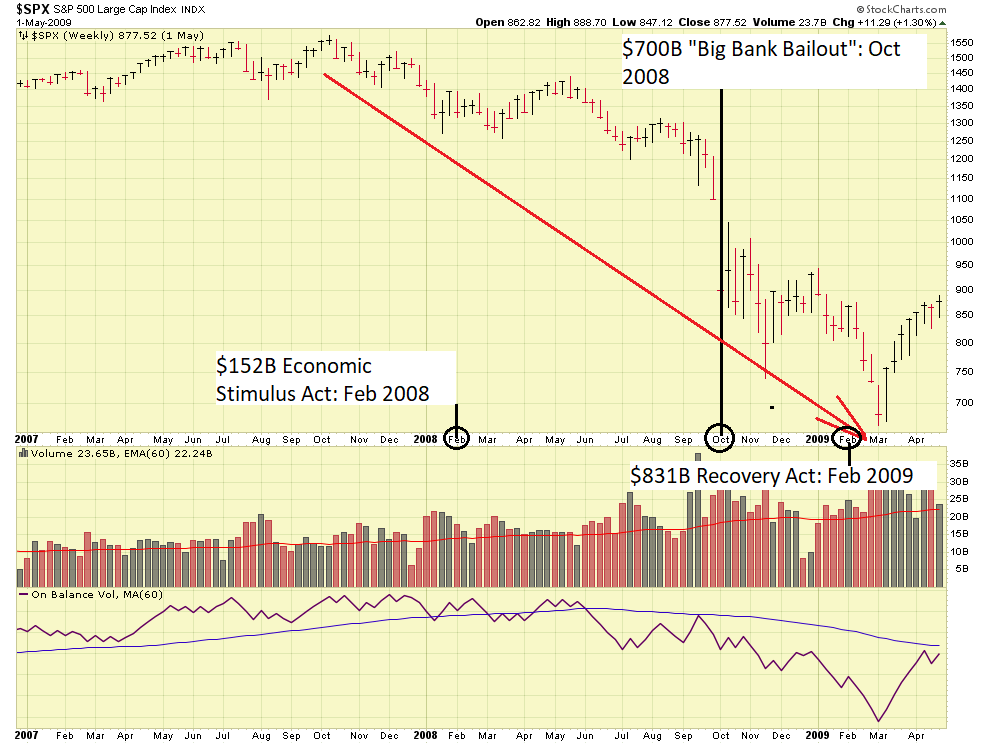
So the next question might be, “Do Bailouts work?”   In the 2007-2009 Financial Crisis, they did not seem to help:

Only time will tell if our elected officials can work together, and put together a package to help the economy.  More importantly in my opinion, is find a solution to COVID-19.

Thank you for reading.  As always, please share this email and my website with those who may benefit from my opinion based analysis of the markets.  You can subscribe via this link:   http://www.thefedtrader.com/contact-us/

Lastly, if you have not already done so, please participate in my poll, which I intend to close after 30 days, located at this link:  https://www.poll-maker.com/poll2788829xc18a487c-82

Thank you….talk to you soon

-Bill Pritchard


Corona Contagion Continues…


Good Evening

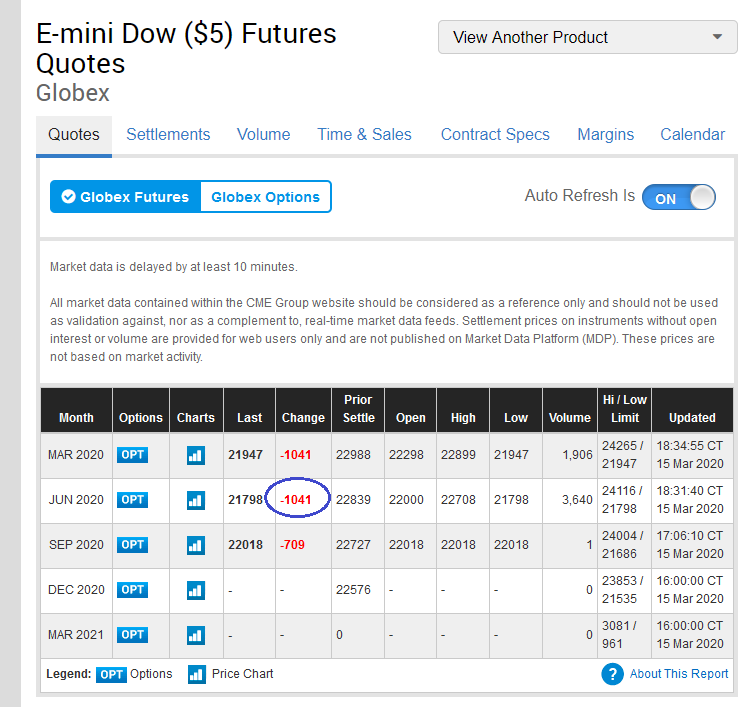
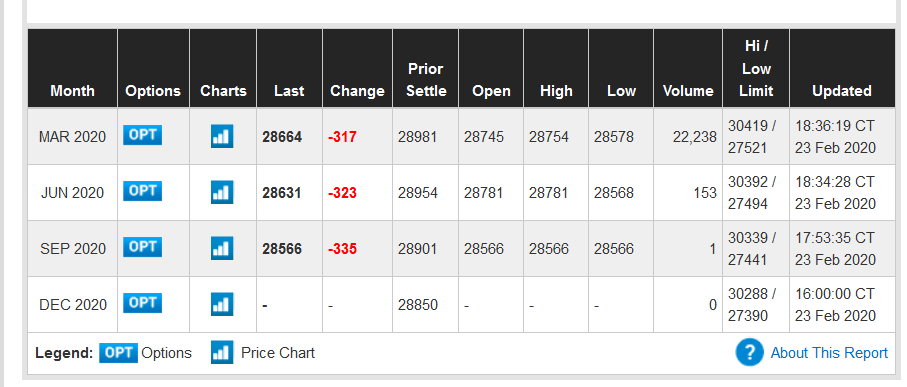
On Sunday March 15, Federal Reserve Chairman Powell announced an “emergency” rate cut, resulting in Federal Reserve rates of zero (0) percent.  Most believe the “Fed” is now out of ammunition to further help the economy, and the markets.   Note that while the Fed’s job is not to prop up the stock markets, the do markets pay close attention to monetary policy.   Sadly, the Dow Jones futures traded 1,000 points down after the rate cut was announced:

Indeed the COVID-19 / Corona Virus situation is a catalytic event, discussed in Question #6 my FAQ.  Such an event can clearly send the market down, (and up), and arguably this is the worst global economic event since Sept-11, and since the Financial Crisis 2007-2009.

On Sept 11, 2001, terrorist enemies attacked the United States, killing thousands of people.  Americans were quick to rally and unite, and efforts to defeat the terrorists began.   During the financial crisis of 2007-2009, banks, lenders, and other institutions began to weaken and display structural problems.  These problems subsequently triggered a financial collapse, and a stock market crash.  Indeed a big deal.

The COVID-19 situation is one that requires humans to remain away from each other.  Reduce/eliminate social interaction.  Change our behavior.  Telework is being advocated, as such, side by side collaboration will be reduced.  Workplace productivity, success, and project completion rates will be impacted.  Try designing a rocketship over email and phone conferences.  Selling cars, real estate, medical care, teaching class, sporting events, high school graduations, are traditionally “in person” activities.  For those employees who enjoy working on a team and accomplishing things together, your team is now a bunch of folks on your email TO line.   Some industries are better suited than others for this type of arrangement. 

The International Monetary Fund (IMF) has already come out and stated that global economic growth will be severely impacted.   The Organization for Economic Co-operation and Development (OECD) has stated that global growth may be cut in half. 

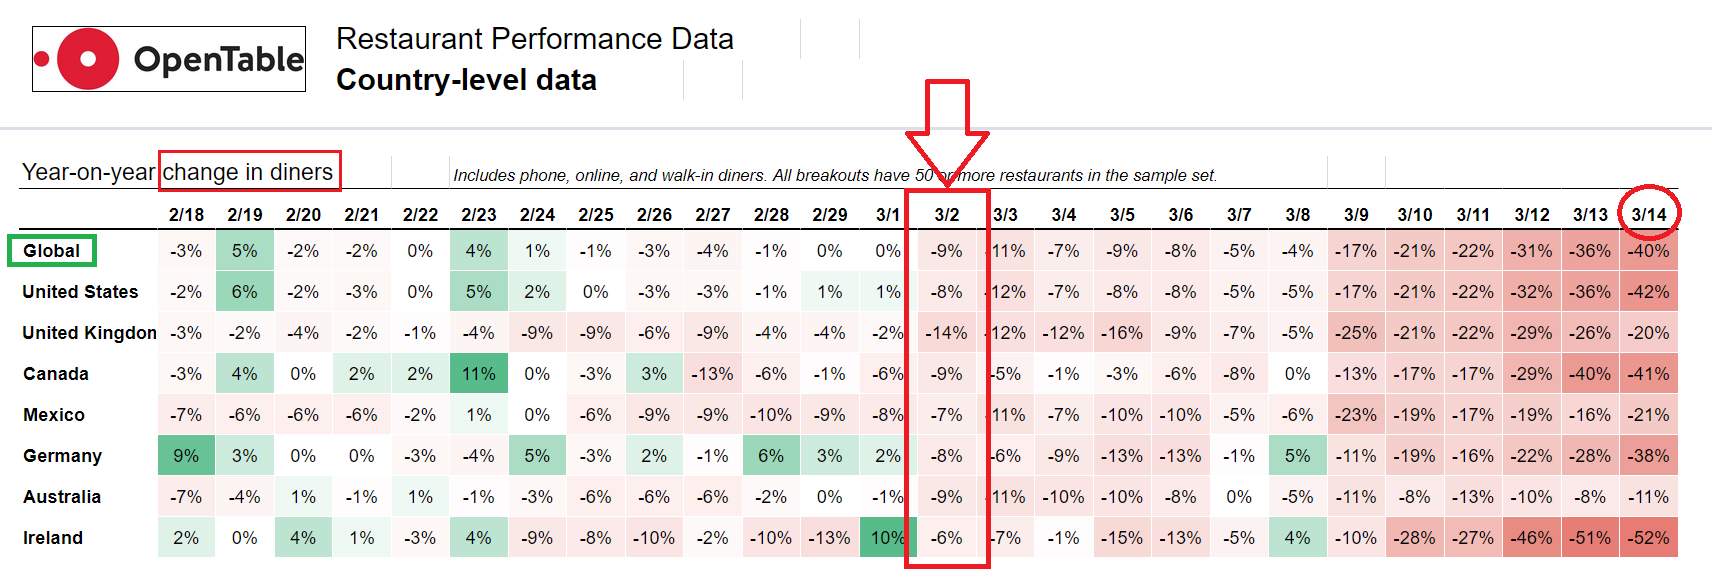
With that, let me share my opinions about COVID-19.   Included below is a chart of “Open Table” online restaurant bookings:

Apparent above is the the fact that despite COVID-19 being talked about since January, nobody (myself included) took it very seriously until recently.  If eating in restaurants (which is associated to social activity and being near other people…) is any indicator, the world was eating in restaurants basically until March 1.  Now, the world did not all get sick that day and decide to stop going to restaurants, but I believe a behavior change began on that date.   If you look at March 8 (one week later), restaurant traffic continued to dry up.   Note that the World Health Organization declared COVID-19 a Pandemic on March 11, and on March 13, President Trump declared a National Emergency.    Hopefully “the word got out” by March 14 that this is a serious problem.  Indeed restaurant reservations reflect that.   Which is great, however COVID-19 has an approximate 14 day time lapse to display symptoms.    As of today, real-time reporting from people I personally know in the health field tell me that many testing sites will not test you unless you display multiple CDC promulgated symptoms, said symptoms which do not all appear simultaneously.  In summary, people are likely carrying the virus and do not know it.  Further more, the 14-day time lapse, coupled with the only-recent realization that this is a serious matter, reflects a potential onslaught of positive tests in April. Date check:  Today is March 15.  I may be rambling incoherently (sometimes this happens…) but my point is the world was out in the public until basically today.  Only now are folks begrudgingly changing their behaviors. 

This will further feed the existing fear and paranoia factor (something we don’t need), as “more and more people are getting infected.”  We now know, using my example above, that many indeed are probably infected now, but known infections still not well known or well documented.  This lack of reporting has arguably encouraged a Laissez-faire attitude in the US, since “nobody has it.”   In mid-April, I (sadly) feel things will be more grim.

As many know, I made some adjustments to my TSP Allocation on Thursday March 12.  The “Bear Market” point was attained on the same day, when the S&P 500 traded below 2715.  It is my opinion that the market will continue much lower.  This concludes my opinion based analysis of the markets for now.

If you have not already done so, please participate in my POLL:  https://www.poll-maker.com/poll2788829xc18a487c-82

Also, I have received some emails and messages to “please sign me up, here is my email address.”  I simply cannot manually enter new 125 email addresses into my free site every night.  I request folks take a look at the following link, and share it with anyone who may enjoy reading my opinion based analysis of the stock markets and impact on the TSP.  Subscribe Linkhttp://www.thefedtrader.com/contact-us/

Thank you for reading…

-Bill Pritchard


Coronavirus infects the Markets


Good Evening

As many know, President Trump spoke during Wednesday evening to the nation.  Apparently his speech did nothing to pacify markets, with Dow Jones futures trading down over 1,000 points.  Common sense has left the room, and pure panic and fear have hit the markets.  As stated previously, (until mere weeks ago), our economy was on solid, strong footing, with full employment, strong housing numbers, and strong GDP.  The economy is now under threat, as various travel bans take effect, tourism ceases, and business travel (the primary source of major airline revenue) slows, instead opting for video conferencing.  As more and more people “self quarantine” (in accordance with government recommendations), retail spending will be impacted, and other areas will be impacted.  Corporate earnings in coming months will indeed be poor.  Which will likely fuel more selling and downward action, resulting in a self-fulfilling bear market crash.

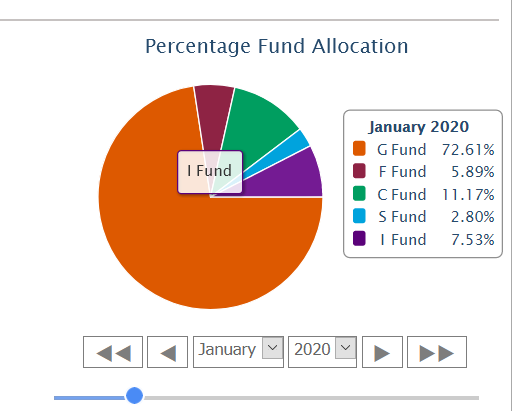
With that I will be changing my Asset Allocation in my TSP to reflect 75% G-Fund, 25% C-Fund.  Why not 100% G ?  Because I still believe: “nothing is (was) wrong” with the underlying economy; I hope (hope is not a strategy, but…) some common sense returns to the markets; and I believe in our country and its entrepreneurial spirit.  We have overcome many things, and we will overcome this.  However simple math also tells me I cannot watch my TSP vaporize.   The above is basically the same thing as the L-Fund, the only difference is my all my non-G fund weighting is in large cap (C-Fund) stocks:

Some will be quick on the trigger that I am “locking in losses” with an asset allocation change..  Fact of the matter is the losses have occurred, and if the particular fund or asset class is not providing the risk/reward balance you desire, you may think about your need to change your asset allocation or an asset rebalance.   Please read my March 8, 2020 post regarding Asset Allocation.  This is not “my” idea, it indeed is “my” action though.   I get some negative fan mail claiming my allocation changes are something I invented, but they are all within the four corners of the TSP handbook, SEC investor education guidance, and trusted financial company publications.

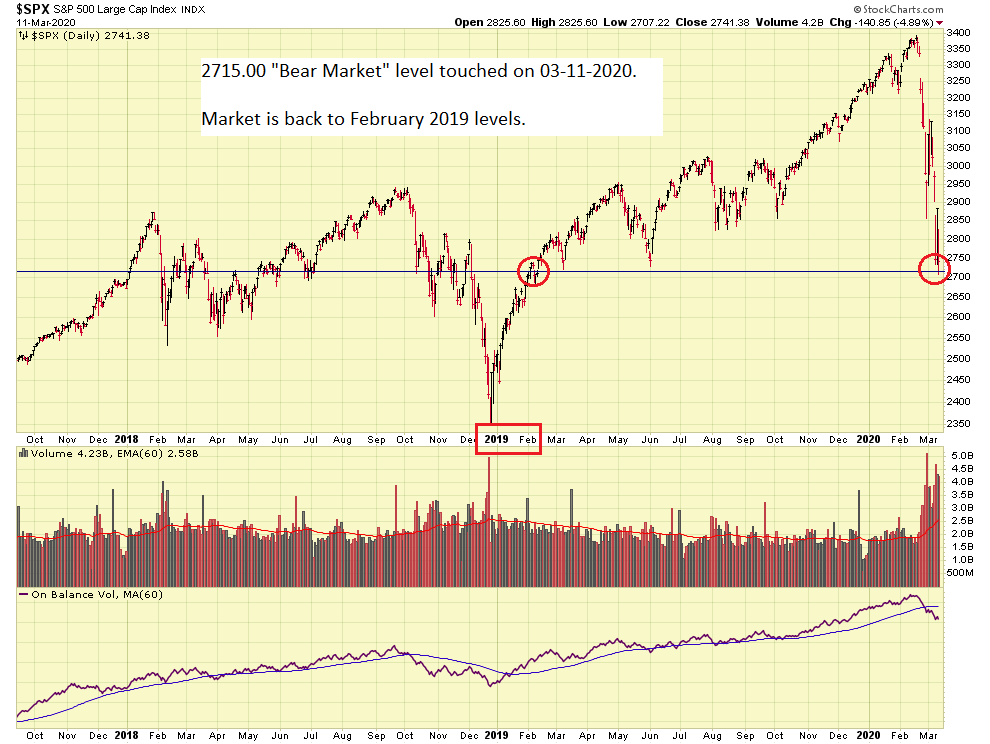
Note that recent action on the S&P 500 has brought it back to 2019 levels:

Also note that the markets are still very elevated and a market crash has still not fully developed.

In the event the markets find some common sense, and the downtrend reverses, my aforementioned allocation of 75% G-Fund and 25% C-Fund (again, very similar to L-Income fund) will see some partial gains.   Observe that Fridays tend to be “sell-off” days…my allocation change should take effect before the market closes on Friday.

I strongly encourage the readership to learn more about asset allocation and making allocation changes.  It is not all about return, investment choices are also about volatility, risk, and time horizon.  A 25 year old employee who plans to retire at age 65 is in a different situation than a 63 year old who plans to retire at 65.  There is not one magic solution for all.

Administrative Notice:  I am posting this because we have a “new generation” of readers, recently coming into the workforce.  Nice folks but the knowledge base and expectation level is different from seasoned long term TSP participants.  This long existing (and free) website, in which I provide my opinion about the markets, and voluntarily disclose my TSP choices, has recently seen an uptick in communications to me with numerous “but why” questions, even some criticism that I “missed some gains” etc.  I get numerous LinkedIn messages asking “Can you answer some questions” or “I know you are busy, but…”   No sweat, thank you for reaching out, but if I spent only one hour a week developing website material, researching the markets, etc., at only one hour a week, that is four hours X $7.25 minimum wage, or $29 a month, in the event I were to put a price on my effort and time.  As such, I plan to stop sharing my TSP allocation choices, and continuing this free site as an analysis-only site of the market’s action.  Before I do this, I wish to poll the readership.   Please take a moment and participate in this poll:

POLL:  https://linkto.run/p/QV49C2P0

Thank you for reading.  Let’s hope the Coronavirus market infection quickly resolves itself.  Talk to you soon.

-Bill Pritchard


Worst day since 2008 for stocks


Good Evening

With the Dow Jones index losing 2,013 points today, March 9, 2020 was the worst trading day of the year.  This was largely Coronavirus related, however a price war between Saudi Arabia and Russia did not help things.   Since many energy companies occupy the Dow Jones Index, this already wounded index was hurt even more.

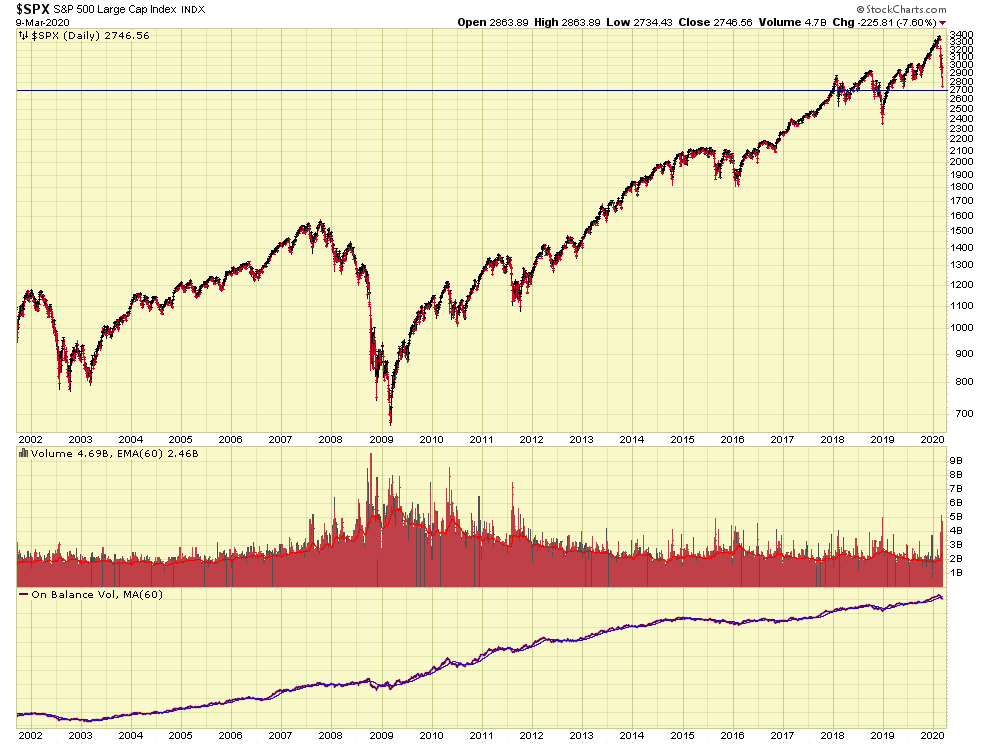
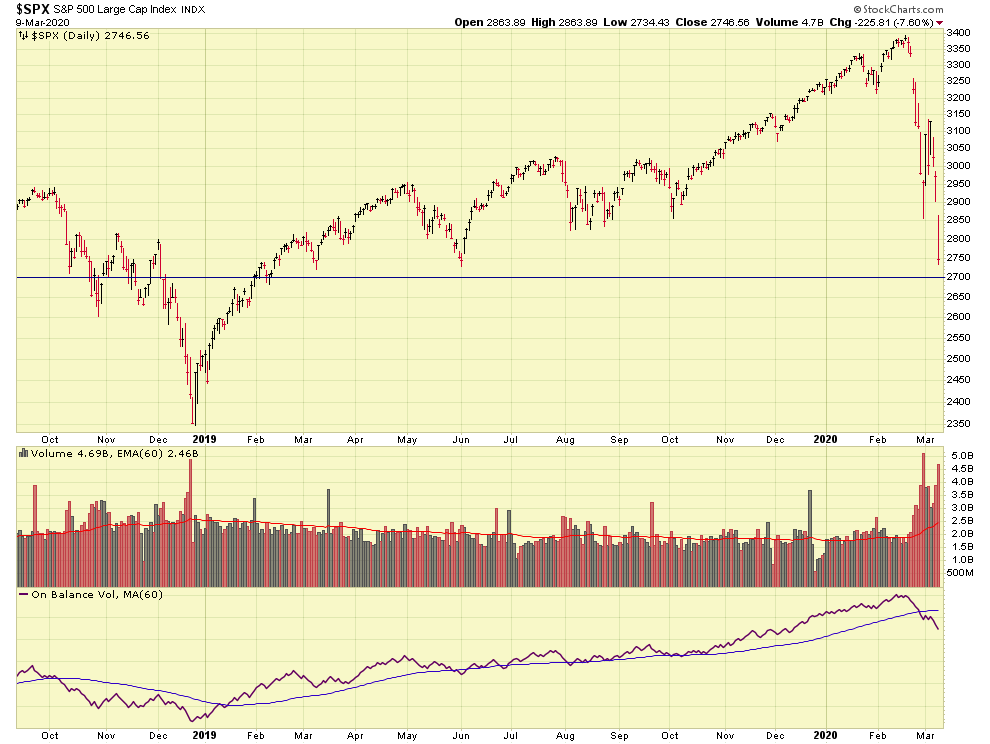
In my prior post I commented that I was watching the 2,700 level on the S&P 500, with 2715.20 as being “official” bear market territory.   Let’s take a look at the 20-year chart, and an 18-month chart of the index, with the 2700 level noted:

Apparent in the above chart is the fact that we are basically approaching Year 2018 levels on the S&P 500.  The pain previously inflicted has erased all of 2019’s gains.   What took 12 months to build, took one month to crash. We have seen this in other bear markets, we saw this in 2007-2009, and in 2001-2003.  This is because buying stock, and making investment choices, whether by the private investor or by a major institution, usually is a result of careful decision making and information gathering.  Selling, on the other hand, typically is not done that way, and is usually a mad rush to “get out.”

This evening, President Trump announced a variety of measures, to include:

1. Payroll Tax relief

2. Financial help for hourly wage earners

3. Small Business Administration (SBA) actions to help small business

4. Hotel, Airline, Cruise industry special measures

The Dow Jones evening futures rallied 500 points on this news, however it is yet to be seen how Tuesday’s stock market will behave.   Let’s keep our fingers crossed.

With a close price of 2715.20 or lower, the S&P 500 will be in a Bear Market.  A few other technical things still need to line up, but cracking 2715 will trigger additional selling and rebalancing of assets in the world, which means things will get much worse, before they get better, once the textbook definition of a Bear Market is attained.

Lets see if it can keep its head above the water.

– Bill Pritchard
 

Dow Futures (evening) lower by 1,200 points


Good Evening

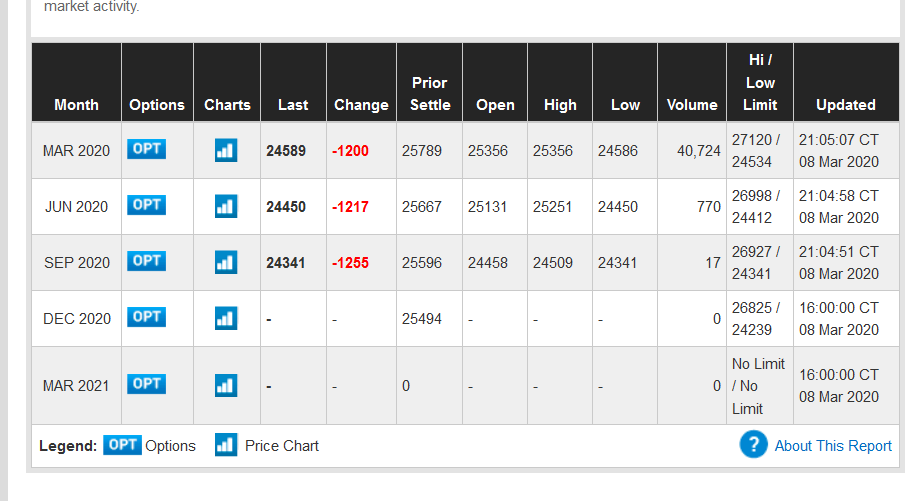
“Quick publish with minimal proof reading” – Just an FYI that tonight’s Dow Jones futures are trading lower by about 1,200 points.  This clearly is undesirable, and while trading sentiment can change between now (11PM Central) and the morning, it is not likely.   As such, Monday March 9 trading in the US stock markets is likely to be bloody, as investors continue to panic-sell out of response to the Coronavirus and its related economic impact.

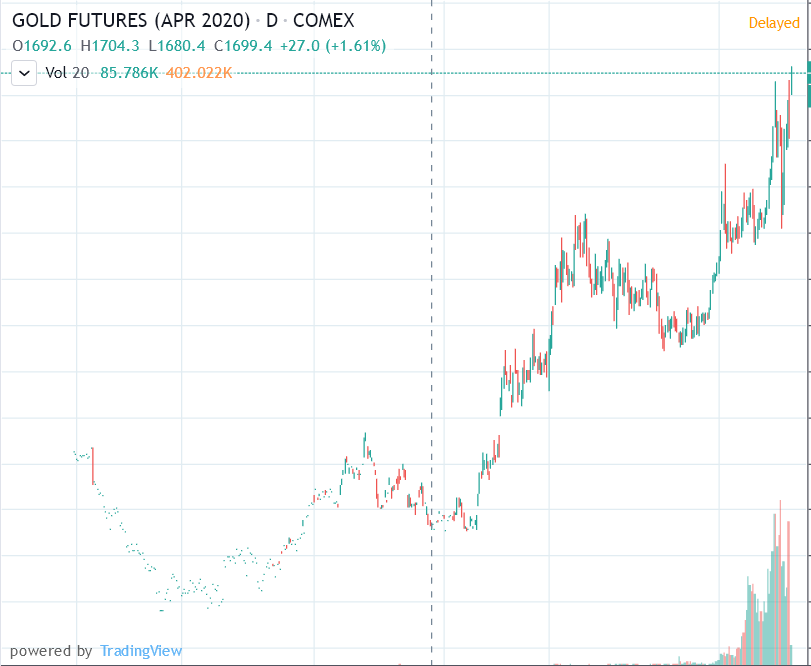
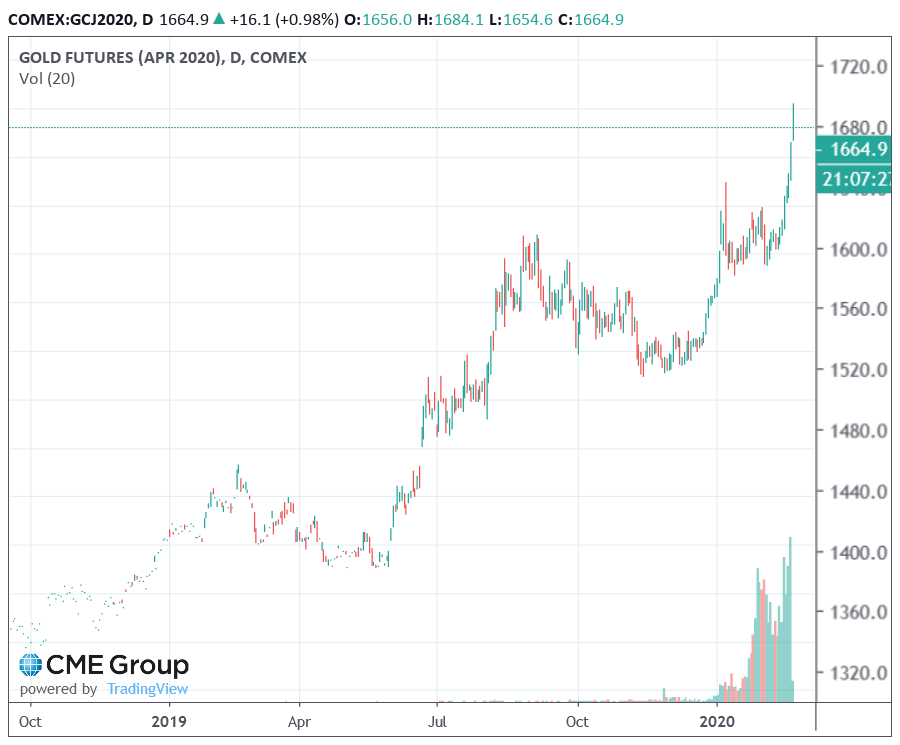
Gold, as expected, is at new highs, being a safe-haven investment:

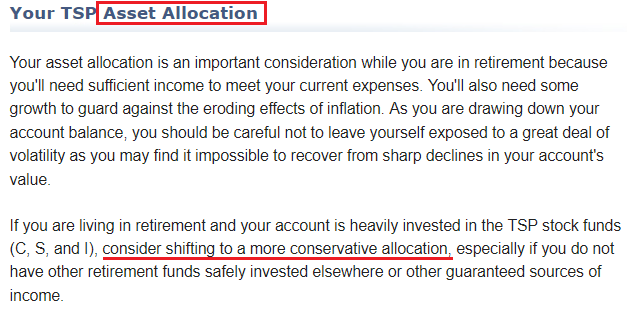
“Great Bill, more charts, what are we supposed to do with this ?” you probably are asking.  Great question, it is one I am asking myself.   Note that retirees cannot contribute into the TSP, as such they are in the most vulnerable camp  in regards to crashing markets.  There is no “continue to make contributions” for a retiree, or “think of it like you are buying shares at a discount” [a belief I have never supported, but…].   A retiree is not contributing, he/she is not buying any more shares.   If I was retired, I might be looking at the G-Fund as an Coronavirus investment option right now.   As a matter of fact, disregard what I said (I will be blamed to inviting flee-to-G-Fund panic), and lets look at what the TSP says for the retirees.  TSP Command Central says:

So there, don’t send me hate mail when I say “consider shifting to the G-Fund”.   Send it to the TSP….

Back to my commentary.

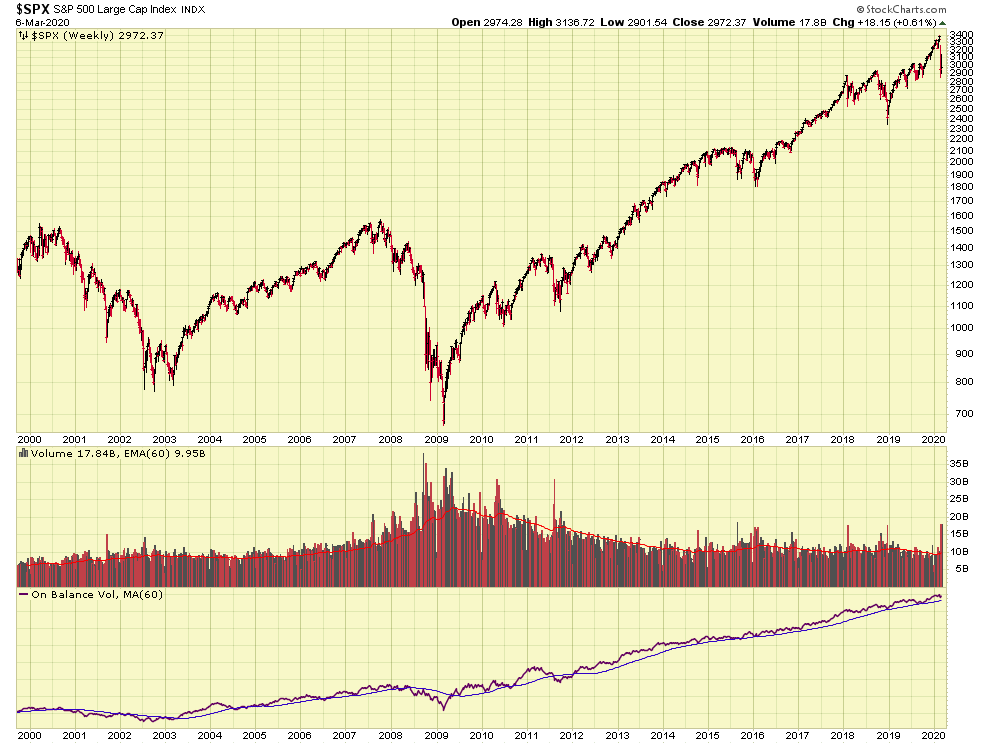
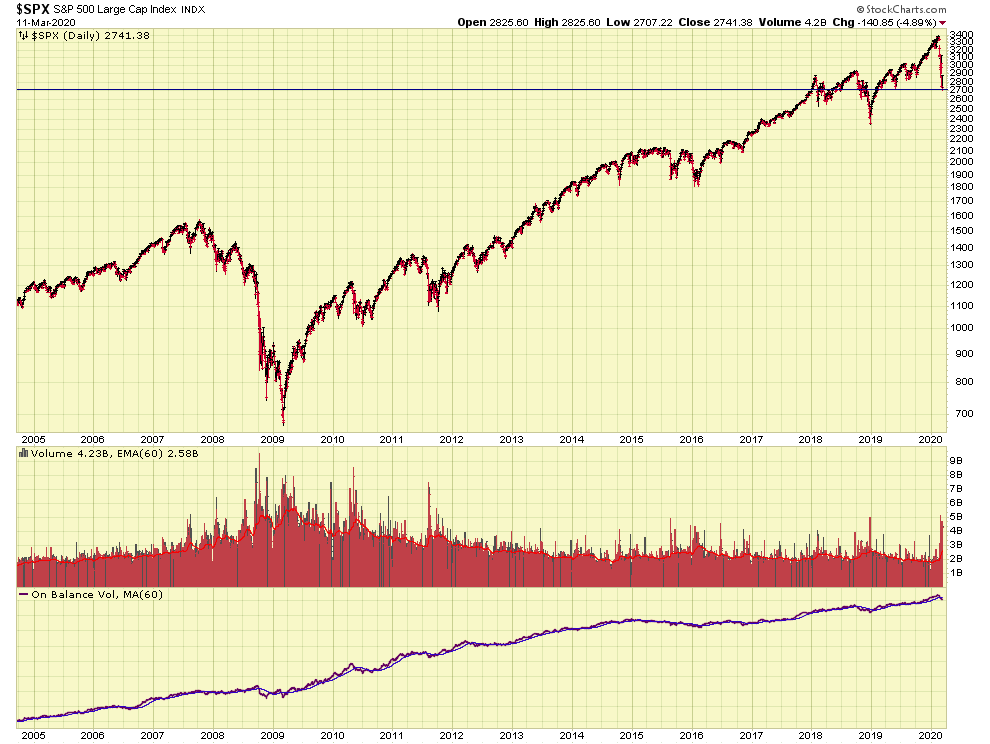
Note that the markets still have a way to go, this correction has not developed into a full blown bear market yet, commonly identified as a 20% decline from the prior high.  On the SP-500, this would be the 2715.20 level, which is 20% from its high of 3394.

Lets take a look at the weekly (versus daily prices) chart of the SP-500:

Lets take a look now at the daily chart, with various support levels noted since May 2019 (approximately 12 months into the past).   You will observe that the 2700 to 2800 zone is where support is found.   My opinion is a CLOSE PRICE (end of day, the market closes) of 2700 or below is cause for alarm.   It also represents an area where an exit to the G-Fund (possibly a partial exit) would still protect earnings accumulated right up to approximately mid-2018.

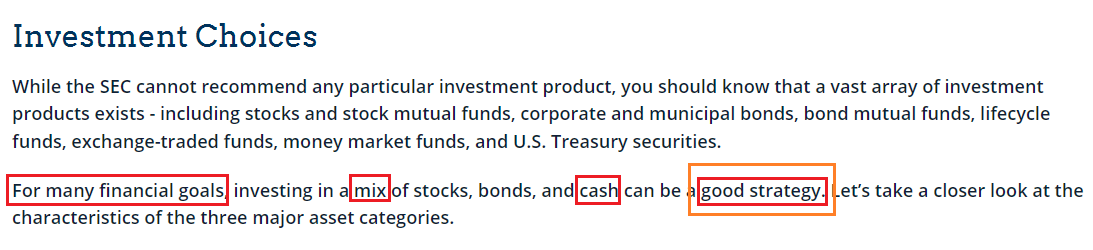
This is a great time for further discussion on “Asset Allocation.”  For the moment, consider Large Cap stocks (C-Fund), Small Cap stocks (S-Fund), etc. to be “asset classes” or “categories” (terms often used interchangeably).   Do not listen to me, lets look at what our friends at the SEC say about Asset Allocation:

As you can see, asset allocation is indeed a tool in the toolbox for reducing risk and exposure to the markets.  Be cautious when you get advice (especially the retirees) to “buy more, it is on sale.”  1) Retirees are UNABLE to buy more 2) The “sale price” may go even lower, RE: Enron, 3) Once losses exceed 10%, it becomes harder and harder to regain them.  A $100,000 balance that is down 30% is now worth $70,000.   To recover that loss (which was $30,000), a gain of 42% is needed.  Only one time in history (at the beginning of the 2003 bull market) has the TSP ever approached that level.  Remember, that is to break even.   If you get this in your inbox, you might get a second opinion:

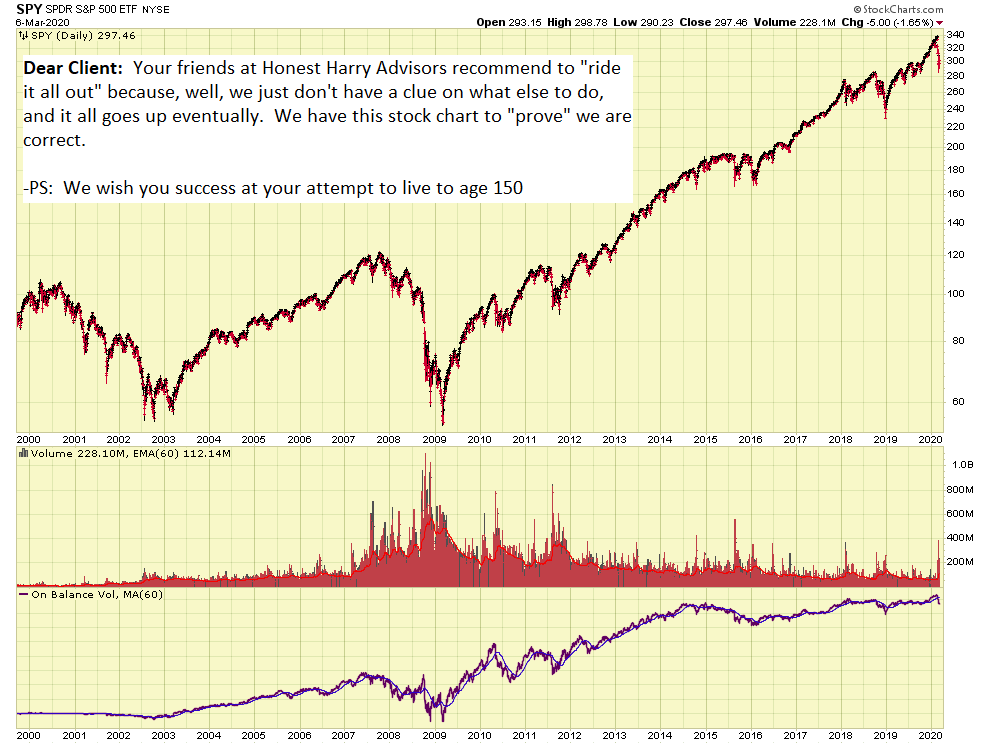
I am not going to beat up the “buy and hold forever” crowd, if it works for you, then use it.  I have my opinions though.  There are 9,599 different mutual funds in America, and 6,900 Exchange Traded Funds globally.   So, apparently there are 16,499 various opinions and investment strategies out there….

Summary:  I am watching the 2700-2800 level on the SP 500, which may be a trigger for me to move some, or all, of my TSP, to the G-Fund.

Lets see what happens this week.  Monday March 9 is not looking good…

-Bill Pritchard


Coronavirus sickens the market – My allocation is unchanged


Howdy folks

Opinion based commentary….

As we all know, the Coronavirus has infected the markets, resulting in severe down days, losses, and extreme levels of volatility.  Call me crazy but I am maintaining my TSP Allocation of 50% C-Fund and 50% S-Fund, as I consider the Coronavirus to be a “Black Swan Event” (discussed previously on my website in 2013 and 2014) and without prediction.  Furthermore, there is no “lead up” to this type of event:  it is panic in nature, akin to somebody saying “fire” in a movie theater and everybody dies because they got trampled to death at the exits.   I ask that the Wall Street folks breathe for a minute.  There is some argument that mainstream media is over-blowing this topic, which, while important, is possibly being used to steer voter opinion in this current election year.

Note that China is indeed the world’s factory.   If the factory closes, the world economy hurts.  No doubt.  I get it, everybody gets that.  If Apple’s Ipad manufacturing is stopped, and they cannot fulfill orders, Apple does not sell as many this quarter, and quarterly earnings are impacted, and the stock goes down.  Look, I get it.   If Japan Air Lines cannot sell tickets to Japan, they loose money.   I get it.  However that data has not come in yet, we do not know exactly the impact that this virus will have on corporate earnings.

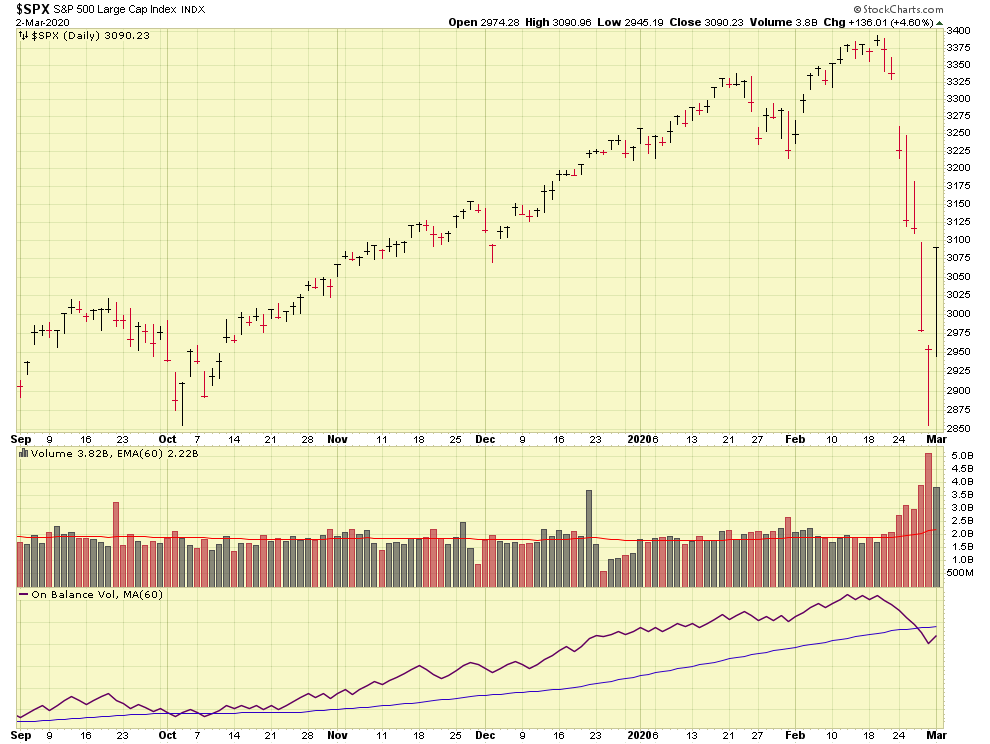
On March 2, 2020, the Dow Jones index rallied 1,293 points, the most it has ever gained percentage wise since 2009.  This was fueled by hope that a global response will occur, via fiscal measures, from the FOMC, IMF, and ECB, to help mitigate downside from the Coronavirus.   Let’s hope this stimulus comes through.

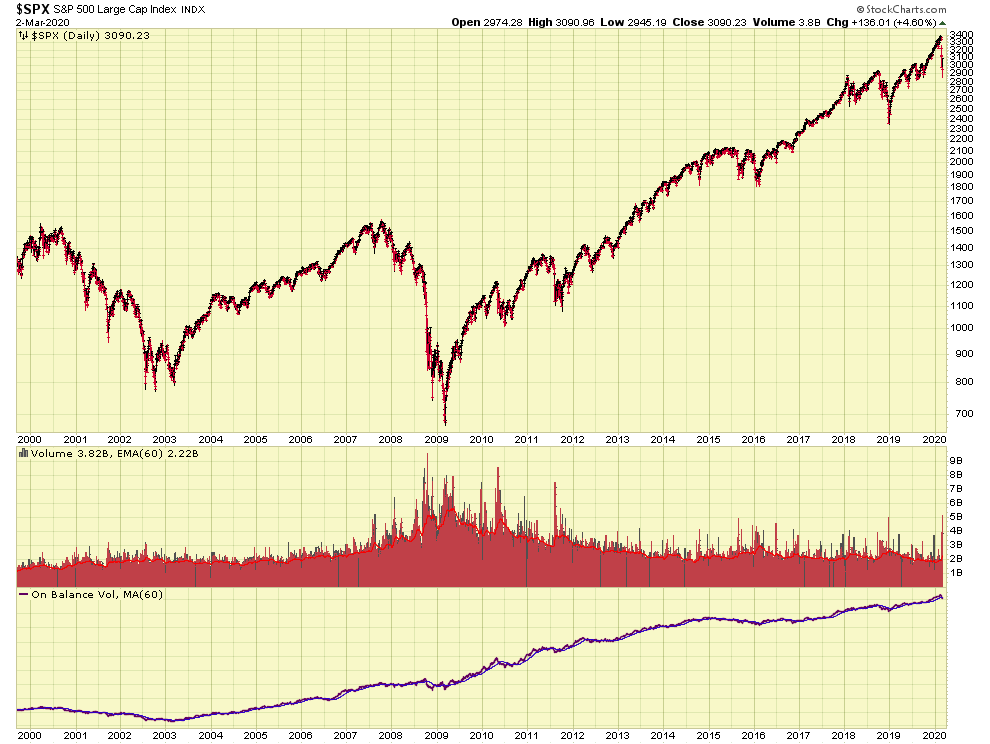
Let’s take a look at the 6 month chart of the S&P 500 Index, then a 20 year chart.  The 6 month chart is painful.  The “big picture” / “long term” chart not so much:

Important !   Does this mean I am going to ride my personal TSP account to zero ?   Watch it vaporize away ?   As most know, I am not a “invest in stocks and leave it forever” guy.   I am also not a TSP day trader.   My strategy calls for an analysis of the fundamental and the technical picture, when that is done, I make allocation adjustments based on my risk tolerance.   When the investor adjusts his allocation, this is called an “allocation strategy.”  Admittedly, going 100% G-Fund may be too risk averse, however for me, myself, and I, this is what helps me sleep at night when it gets stormy outside.

Side note:  Over the years, a few TSP information sites have come and gone, one fairly popular one stopped publishing all together, leaving a bunch of subscribers wondering what happened.   That site, like many others, was run by somebody using a pseudonym name.  Other sites have no identifiable human owner, just some PO Box addresses.   Mine (this one) has existed in various forms since 2001, or almost 20 years.  I believe I am accurate to state that this site has expanded and enhanced a lot of people’s understanding of the TSP and the markets.   I would ask that people stick to who they trust, our (my) opinions may not triple your accounts by next year, and you may disagree with those opinions, but at least you know what you are getting from the start.   I would recommend folks continue to pay attention to Dan Jamison, CPA of the FERS Guide, and Chris Barfield, CPA of Barfield Financial (check LinkedIn or google search).   Both Dan and Chris provide outstanding benefits and TSP related information.  I highly recommend listening to what they say.  They are real humans, and you can trust them.  Kind of a big deal in today’s world of internet, overnight popup websites, and the impersonal advice industry.   Just my opinion…

With that said, my TSP Allocation is unchanged (for now).

Thank you for reading….

-Bill Pritchard
 

Dow Futures drop 300 points on coronavirus Fears


Good Evening

FYI that Dow Jones futures are reflecting a 300 point drop down, attributed to continued coronavirus fears.  If this continues into the morning stock session, the markets will have a painful Monday.   See current futures values:

Gold futures are also trading up, classic “safe haven” behavior when stocks are down:

Note that the “Coronavirus” has many similarities to the common flu, per John Hopkins University: https://www.hopkinsmedicine.org/health/conditions-and-diseases/coronavirus/coronavirus-disease-2019-vs-the-flu

Harvard University Medical School states that preventative measures against the flu will likely also work for coronavirus:  https://www.health.harvard.edu/blog/be-careful-where-you-get-your-news-about-coronavirus-2020020118801

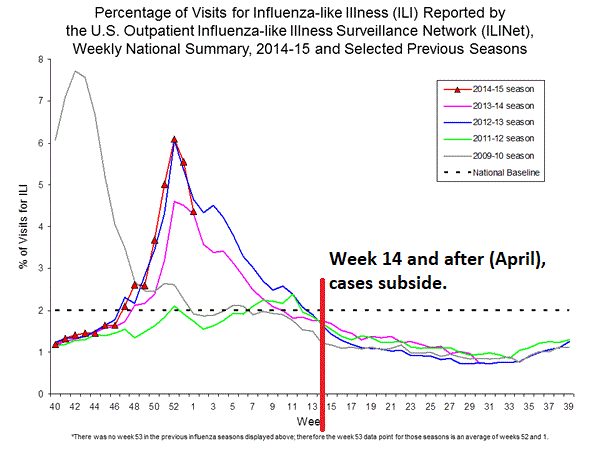
With the hypothesis that the flu and the coronavirus are similar, it is important to note that investment decisions should come with the awareness that flu cases subside in April:

Being that we are soon entering March, I see no reason to panic-bail out of stocks and into safer investments such as the G-Fund, as I see the coronavirus situation as short lived.  Longer lasting economic impact may indeed occur, however it is not known what, if any, effect, this will have (long term) on the stock markets.

For now, my TSP allocation remains unchanged.

Lets hope that April gets here soon, and that the coronavirus cases start to subside.

Thanks for reading….

-Bill Pritchard


Allocation change as headwinds Disappear


Good Evening
Bottom Line Up Front:   Effective this evening, I will be making a change to my TSP Allocation, to reflect 50% C-Fund and 50% S-fund.   Allow me to discuss my opinions regarding this change to my personal TSP.

Before I proceed, allow me to conduct some light discussion regarding some talk about being “too conservative” or “missing gains” due to G-Fund exposure.  As has been mentioned numerous times on this site, the G-Fund is purposed to protect your account from loss, not designed to obtain great gains.  Long term exposure, lasting a year or longer, while not desirable, may satisfy the TSP account holder’s risk tolerance, if the account owner has bonafide and good faith belief that there is heightened market risk to his account.  Low rates of return aside (observe that capital gain is not the purpose of the G-Fund), the G-Fund remains the most popular TSP fund that exists.

Observe that the TSP plan uses the G-Fund heavily in the lifecycle funds, at times 70% allocation is witnessed in the G-Fund: the L-2020 fund distribution is:  https://www.tsp.gov/InvestmentFunds/FundOptions/fundPerformance_L2020.html

My opinion is that numerous “headwinds” are now absent from the market landscape, most notably the US/China tariff war, and the Senate trial regarding the impeachment hearings targeting the President of the most powerful country in the world.   On December 12, 2019, US/China reached an agreement in regards to tariffs, with additional tariff easing to occur on February 14, 2020.   On February 5, 2020, the Senate trial mentioned above ended with an acquittal.

The only major issue impacting the markets, in my opinion, is trade issues associated to the Coronavirus, which has killed over 900 people worldwide as of today.  Sad indeed, but it should be noted that over 59,000 humans die from rabies annually.  I have never met a human with rabies, but statistics reflect a greater chance of meeting one versus a Coronavirus victim.  Am I going to purposely travel to known Coronavirus locations ?  No, nor would I enter an cage with rabid dogs.  With that said, based on the above numbers alone, am I going to panic and worry about normal everyday life, because the Coronavirus is all over cable TV news and morning talk shows?   Probably not.   As such, I believe any market panic associated to the coronavirus is overblown.   The SARS virus, another well known epidemic, dating back to 2002, resulted in minimal market response.  Most academics cannot pin the market downturn in late 2002/early 2003 to the SARS virus, as the downturn was likely tied to post 9-11 issues facing companies and travel. Note that the markets indeed rallied subsequent to the March 2003 invasion of Iraq:

Let’s take a look at some charts of the SP-500 Index and the SPY Exchange Traded Fund:

Apparent is the fact that volume swelled in December 2019, consistent with the market embracing the tariff agreements, this continued until late January 2020, when the Coronavirus sell-off occurred, which then abated in early February.  On February 6, 2020, a new All Time High occurred, when the SP 500 index reached the 3347.96 level.  It then set another All Time High today, February 10, 2020, reaching 3352.26.

I see no headwinds for the markets in the viewfinder at this time.   It is important to note that this is an election year- turbulence can be expected as we approach the Nov 3, 2020 election.

I will readjust my TSP Allocation to reflect 50% S-Fund and 50% C-Fund, due to my opinion that the market headwinds have dissipated.

Thank you for reading, hope everyone is having a great 2020 so far !   Talk to you soon…

-Bill Pritchard