
Hello Folks
Bottom Line Up Front: My TSP Allocation/Contributions remain 50% C-Fund and 50% S-Fund.
The month of February, historically the flattest month of the year, is thankfully behind us. The markets witnessed increased volatility, with the VIX (Volatility Index) seeing drastic swings during the first two weeks of the month. See chart:
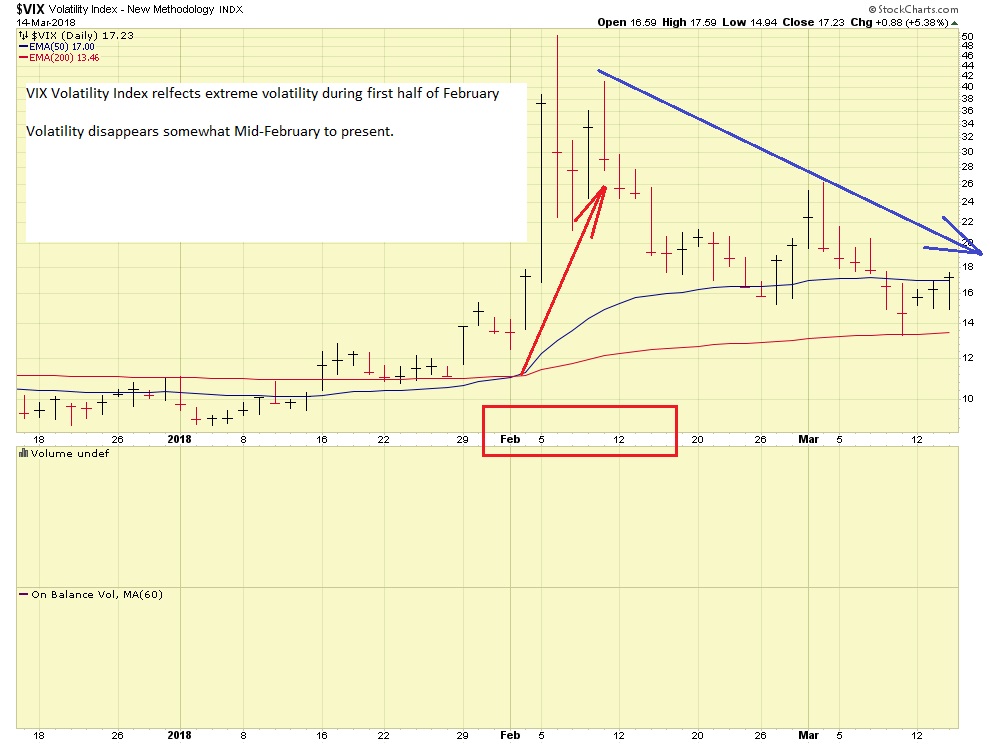
Since mid-February, volatility has returned downward to “calmer levels” however the markets remain very sensitive to news out of Washington DC and to any policy/leadership changes in the agencies. This, in addition to interest rate hikes, and inflation data, seem to be what sets the market’s mood for the day. Before digging deeper, lets take a look at TSP returns for February. Note that (as stated above), I am 50% C-Fund, and 50% S-fund. I am not currently in the I-Fund, as I foresee the dollar eventually getting stronger, in response to a “bring business back to America stance”, the effect of which will admittedly not happen overnight, and independent of that, due to my belief that the US business climate is arguably operating in the strongest pro-business federal administration in history. This will eventually help share prices of US equities as tax and regulatory reform benefit American business. What you do with your TSP, is your business, if you are in the I-Fund, my opinion is nothing is “wrong” with that, however I am not in the I-Fund, for the reasons outlined above.
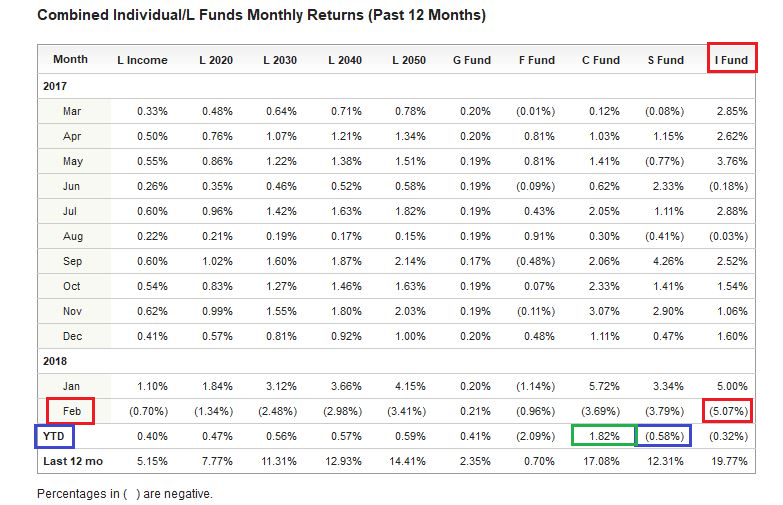
You will see that “Year to Date” (YTD) data reflects that the C-Fund is the only fund with a positive return, YTD. Note that in February, all funds were negative, with the I-Fund being the worst performing of all.
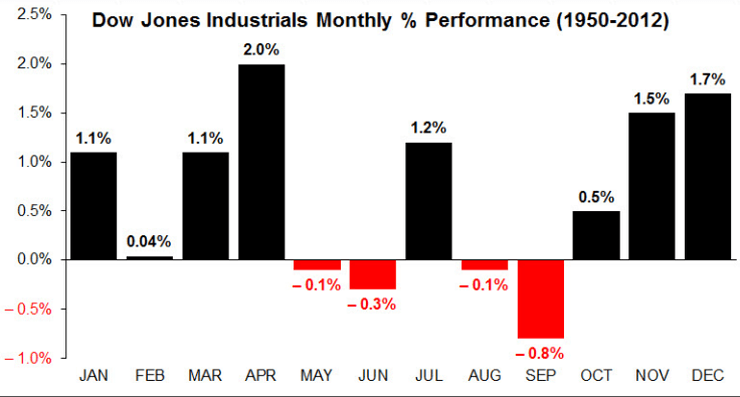
However one-month returns do not make for a long-term behavior pattern, indeed they are part of it, but one bad month does not make for a bad year. Note that February is historically the flattest month (Dow Jones Index) during the year. See chart (I have posted this before but recent subscribers have not seen this):
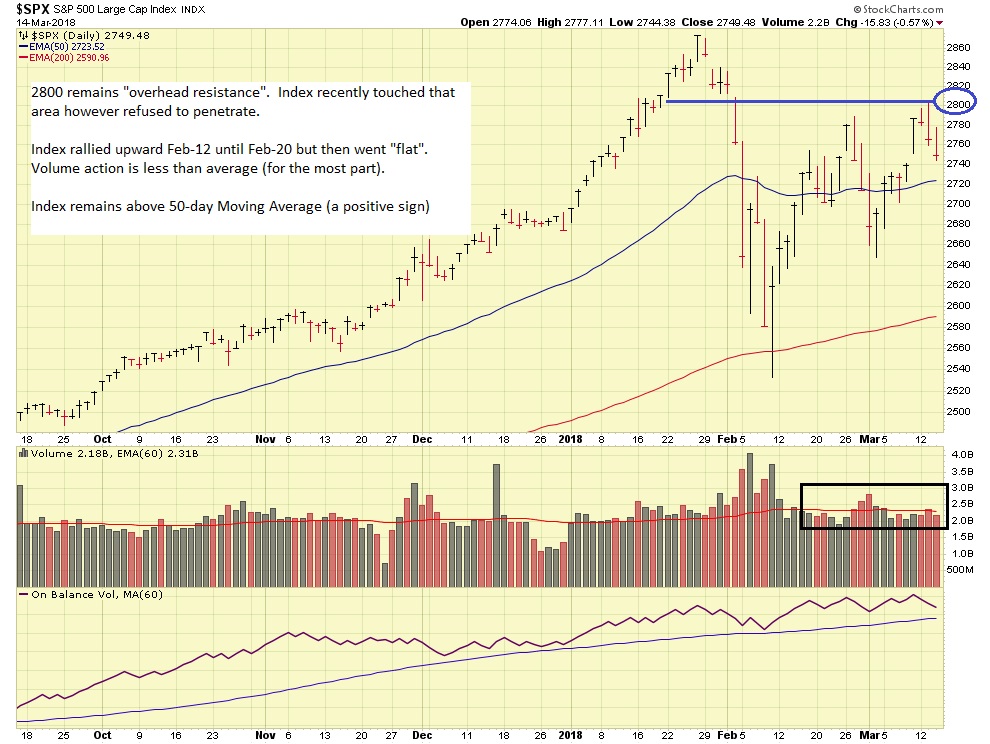
With that said, let’s do a short opinion-based overview of recent market action, and some of the causal factors. Allow me to insert a chart of the SP 500 Index to get started:
The markets had a huge sell-off in early February (discussed in prior posts) and then remained mostly flat the rest of the month (in accordance with historical behavior). On February 14, Core CPI data was released, an important inflation measure, coming in at 1.8%, a the same level it was at in Jan 2018, December 2017, and basically unchanged all the way back to April 2017. Recent Core PCE Inflation data reflects no increase over past reporting periods. All of this is resulting in fuddled economists asking why inflation has not creeped higher. Some believe the FOMC may raise rates two or three times, versus four times, this year, as a result of the pacified inflation data.
On February 27, new FOMC Chairman Jerome Powell spoke for the first time to Congress, sharing his view that the economy is performing well. If you wish to watch the three-hour video, the link is here: https://www.c-span.org/video/?440903-1/federal-reserve-chair-powell-testifies-monetary-policy-economy
On March 1, President Trump publicly discussed trade tariffs for the first time, sending the Dow Jones index down 420 points, a “panic response” with no clear data or reason for worry. On March 8, tariff paperwork was signed by President Trump, with the date of March 23 being the date they “take effect.” A strong positive for the economy was observed on March 9, with “revised payroll numbers” showing that the economy gained 313,000 jobs in February, not 222,000 jobs as estimated. This 41% improvement in job activity resulted in a positive day in the markets.
As we approach mid-March, my observations are that additional distribution (sell-off days) have indeed occurred on the indexes but that volume is below average, which eases my worry somewhat. As seen on the SP 500 chart above, 2800 remains the overhead resistance level. The index remains above its 50-day moving average, a useful tool to identify the trend.
Summary: My TSP allocation/contribution remains 50% C-Fund and 50% S-Fund. The month of February, consistent with prior years, gave us minimal returns. Entering March, we have seen some sell-off days but nothing (for now) has me greatly concerned.
Thanks for reading. Please share my site, and retired FBI Special Agent Dan Jamison’s site, The FERS Guide , with your friends and colleagues. I often get questions in regards to benefits, retirement calculations, “perfect age to collect social security”, and other stuff, and those are outside of my wheelhouse. Keeping my finger on the pulse of the market (which directly impacts the TSP funds) is hard enough as it is. For those questions, please reach out to Dan Jamison, who is fluent and the expert in such matters.
Thanks again and talk to you soon…
-Bill Pritchard
