Monthly Archives: February 2018

S&P 500 and Dow briefly enters correction Territory


Hello Everybody

Note:  My TSP Allocation/Contribution remains unchanged.  I am closely watching things and yes, my fingers are closer to the G-Fund button than they were before, however I have changed nothing.

The last two weeks have been quite turbulent.  We witnessed thousand point swings on the Dow Jones index, panicky financial headlines and fear mongering by the press, and more importantly, account balances and portfolios being damaged.   Bloomberg Press recently published an article mentioning how the reason behind the selloff is not identified:

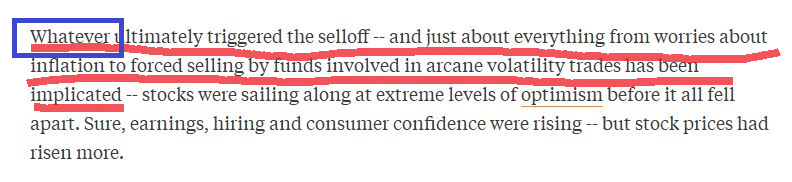
Indeed, depending on what channel you watch or which expert you listen to, the theories abound.  I would not get too wrapped up in theory but instead stick to objective, identifiable market behavior and economic data.  The markets indeed went down, that is undisputed.  Allow me to share my opinions on things and it should become apparent why my comfort level is still (mostly) unshaken.

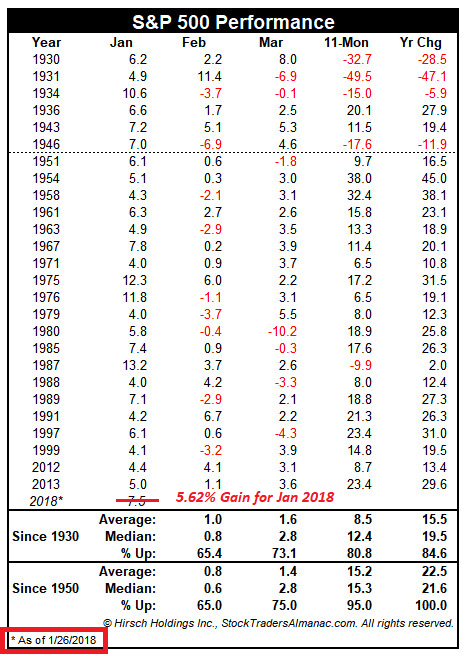
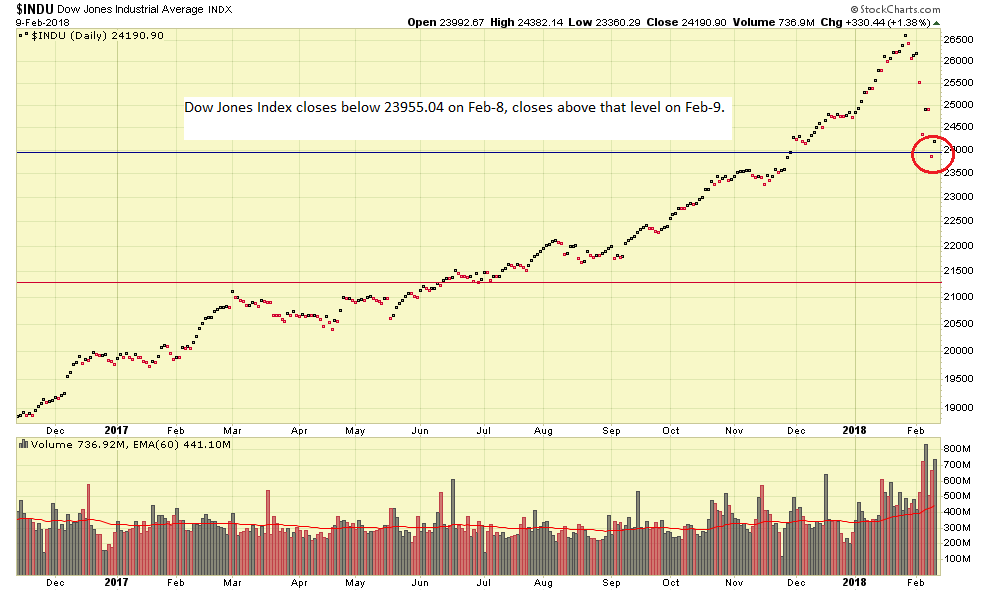
Let’s begin our discussion with the idea, shared by most on Wall Street, that a “Correction” is a 10% minimum decline (from a peak, or high) in an index.  Also lets identify that a “Bear Market” represents a 20% minimum decline, and is also reflective of a new, sustained, downward direction in the markets.   Bear Markets typically last six months to 2 years, Corrections typically last anywhere from one to 12 weeks.  Recent volatility requires tightening up the seat belt and putting the tray tables up, but occasional turbulence is not abnormal.  “Are you telling us that 1,000 point swings in the Dow is normal?”  No, I am not, but as I discussed in my prior post, look at daily percentage losses, not point swings.  Also, keep in mind the Dow is 30 stocks.  Do 30 stocks represent the entire stock market, and health of the economy ?   In my opinion no.

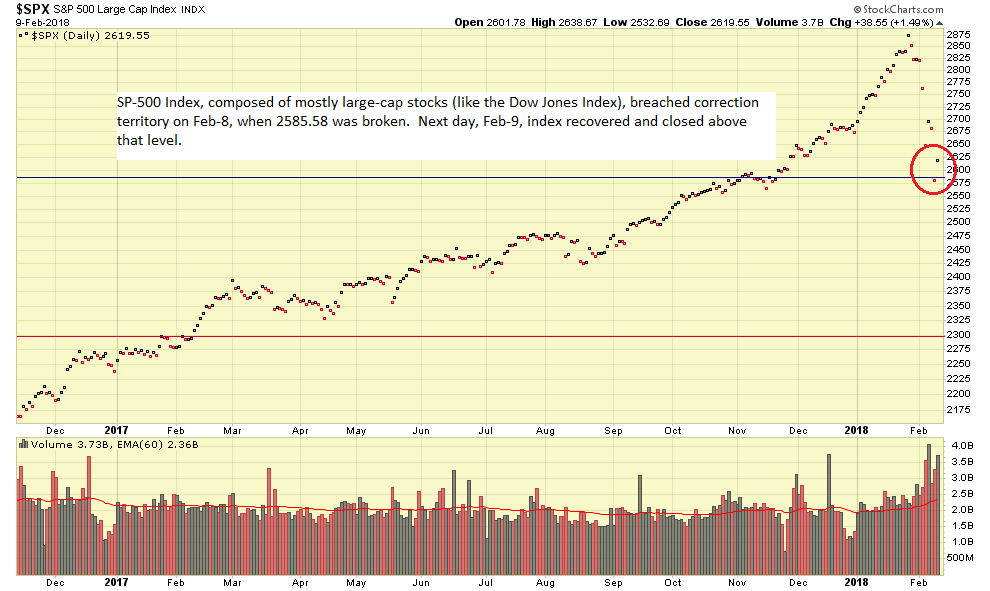
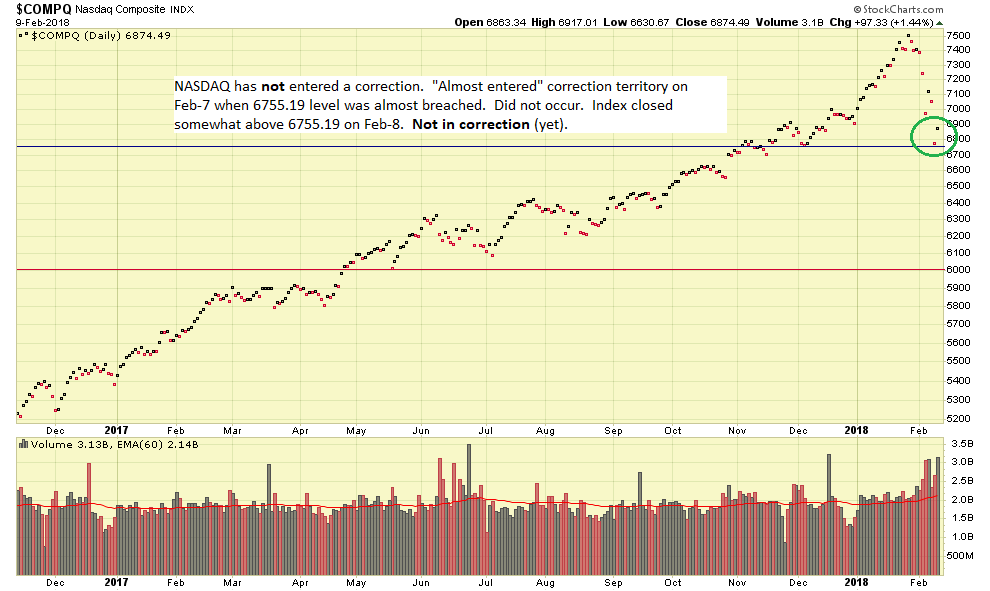
Surprisingly, if you use “Close Only” prices which eliminates intra-day volatility, no indexes are currently in correction territory.   The NASDAQ got close, but never entered it, and the SP-500 and Dow (both containing large cap stocks) touched it briefly but exited on Friday, Feb-9.   Many feel that “closing prices” better represent sentiment, as that was the last price before traders went home for the day.  In my charts, the 10%/Correction level is a horizontal blue line.  The 20%/Bear Market level is a horizontal red line.   Lets look at all three indexes:

Theories aside, my opinion as to why this is happening is:

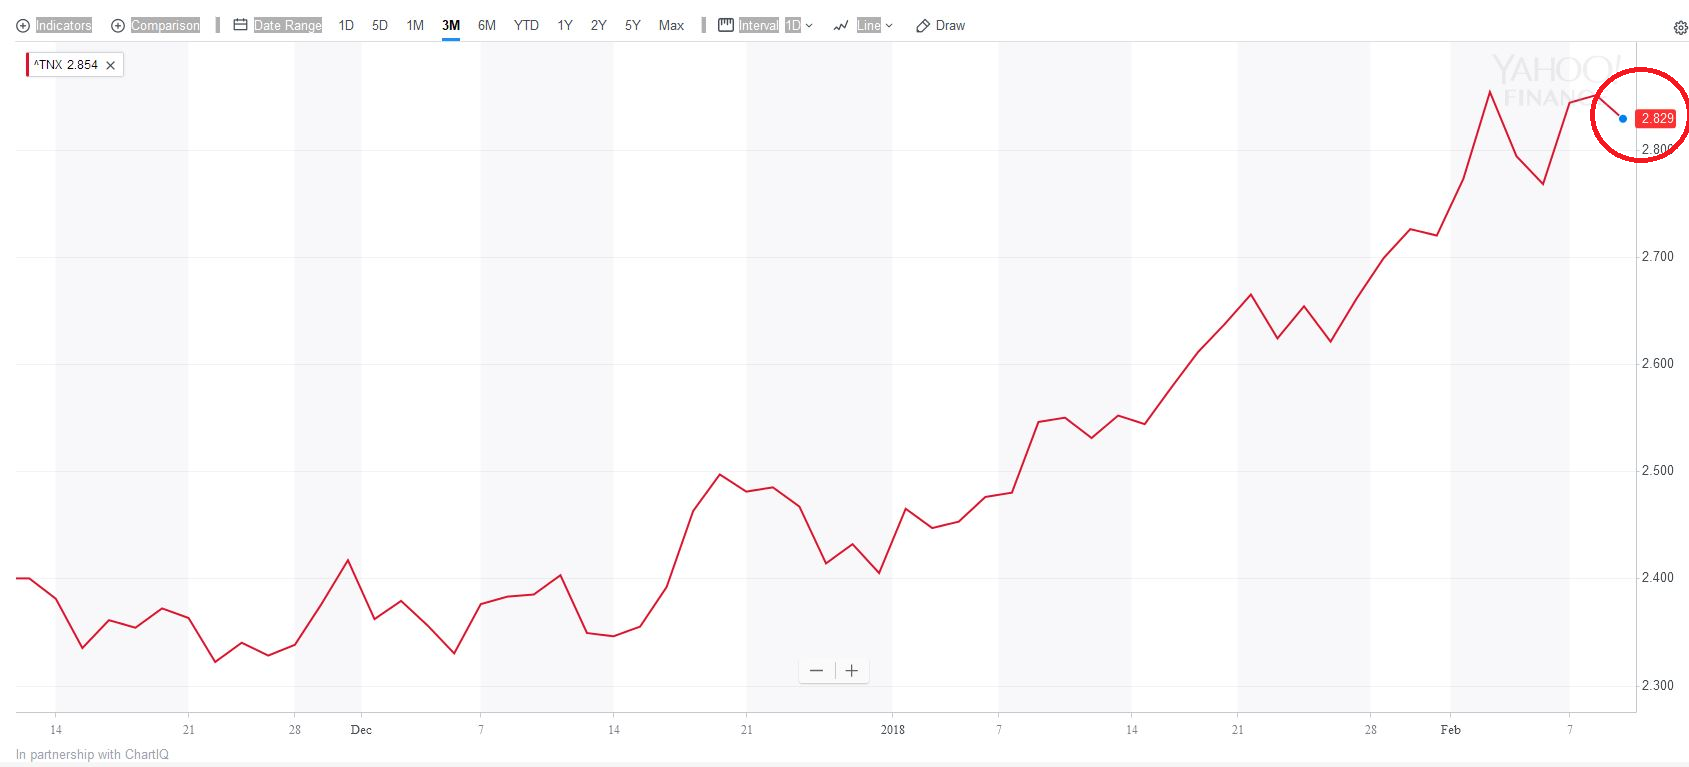
  1. 10-Year Treasury Yields reaching 3% Level
  2. Fears of interest rate hikes by FOMC
  3. Concerns about inflation

Lets take a look at the Treasury Yield chart, indeed it is on a steady climb.  Many believe that 3% is an important psychological level.  Yields above this fuel fears of interest rate hikes by the FOMC, who will meet in March.

Under new FOMC leadership, a new metric may be used, but under prior FOMC Chairperson Janet Yellen, the FOMC has used 2% PCE Inflation as the trigger point to consider raising rates.  This is discussed in my March 11, 2015 post here.

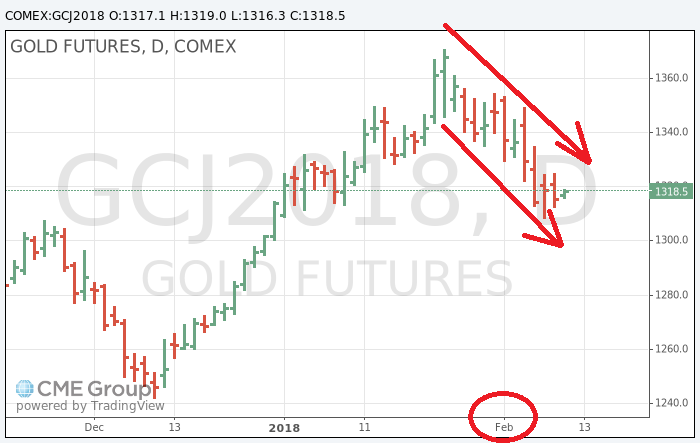
It should be noted that when inflation is feared, and when stocks go down (dare I say in a “bonafide move down”), Gold Prices (Gold=Inflation hedge and safe haven currency) typically will go up.  This has not happened, while ostensibly the world is crashing around us.   Let’s take a look at the Gold chart since February:

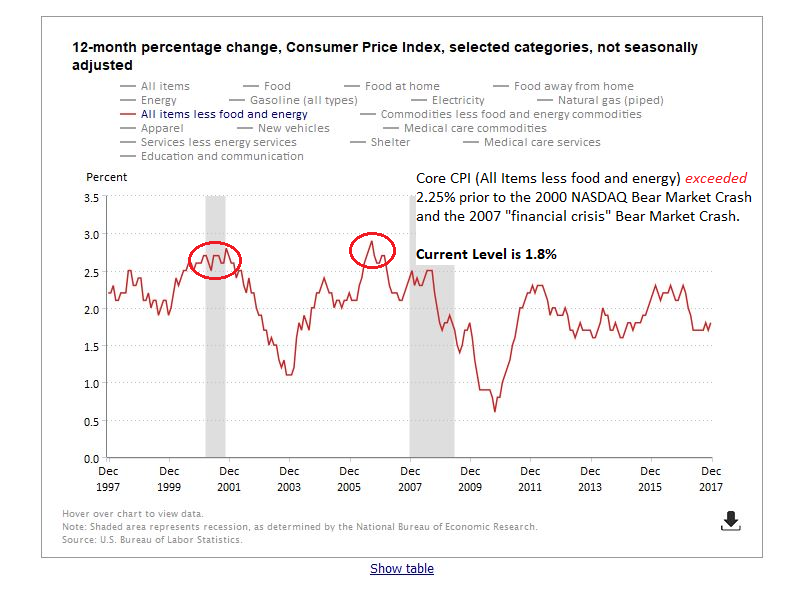
Recall that the FOMC’s preferred measure of inflation is the PCE, not CPI, although the CPI does provide inflation related information.  The next release of CPI data will occur on Feb-14 (Happy Valentines Day…).   Again, the FOMC prefers PCE data.   CPI Chart below, most recent data reflects a CPI of 1.8%.  Ideally it retreats to 1.6% or 1.7% on Valentine’s Day release.  Note that leading up to the recent Bear Markets (sustained downtrends) in  the last 20 years, the Core CPI exceeded 2.25% on  a multi-month, consecutive basis.  We are not there.

Recently we have had panic and negativity, let me introduce some optimism.   Based on my analysis of things, my opinion is a Bear Market (an extended and sustained period of damage) is not immediately ahead.  Yes, we touched correction territory.  The US business environment has arguably never been healthier, and with reforms and tax cuts (Note:  Tax cuts indeed reduce revenue to pay our financial obligations and impact our US Dollar, that is another topic…) will serve to benefit the stock market.    Since 1950, seven out of nine Bear Markets occurred in a recession. Recession is a bad thing, think about foreclosed homes, unemployed people, and lost jobs.  We are not in a recession.

To quickly touch on recent action, Friday Feb-9 witnessed the markets closing strongly up, with Investor’s Business Daily reporting this as “Rally Attempt Day-1.”  This is an important concept, typically after four rally attempts, the market will begin a new uptrend and enter a new bullish phase.  Coincidentally, the dates so happen to line up that Day-4 (if it rallies every day) will be Feb-14, the same day that CPI is released (in the AM).

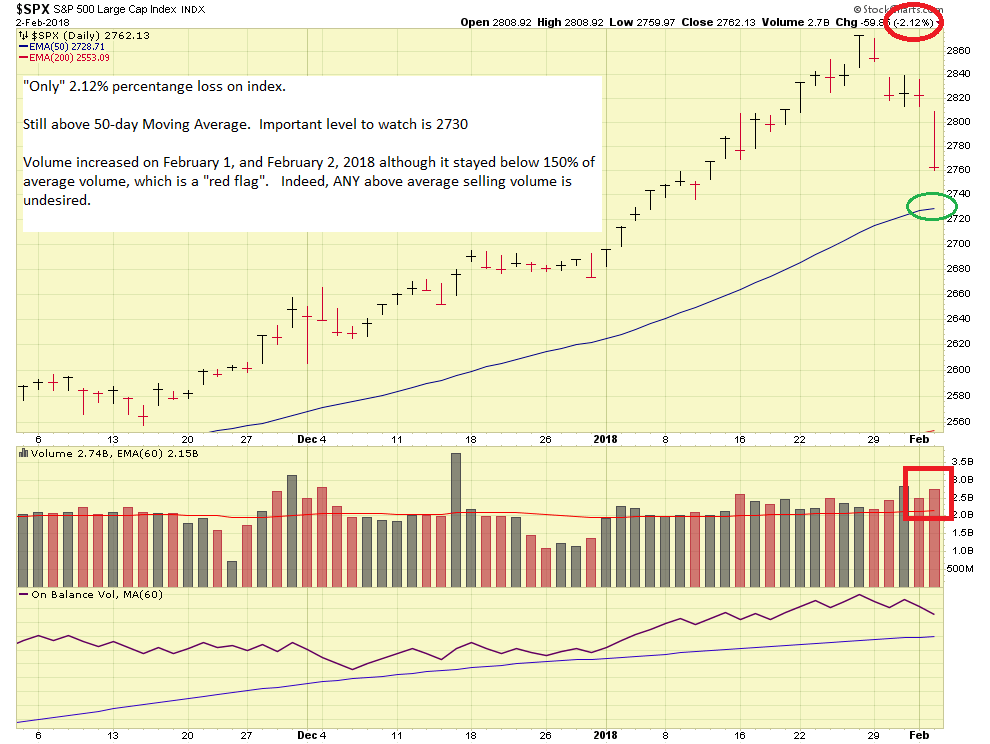
Some inquired about my comment from my prior post, regarding the indexes below their 50-day Moving Average.  Indeed, this is not preferred, but this just means that “there is work to do”, time to deep-dig analysis on economic data, stock charts, and other information, before any drastic decisions are made.

As a result of the above, my TSP Allocation remains unchanged.   Let’s see how this week plays out, CPI on Feb-14 indeed will be something to watch.

Thanks for reading, talk to you in another week or two.

-Bill Pritchard


Stocks down hard – My Allocation remains Unchanged


Hello Folks

Bottom Line Up Front:  My TSP Allocation/Contribution remains unchanged.

Most know that the Dow Jones index closed down 665 points on Friday February-2.   This prompted quite a few folks reaching out to me and asking if I was worried, and “why didn’t I see this coming.”   Most panic and emotionally fueled market days are impossible to “predict”, I can’t control if someone screams fire and everyone runs for the exits.   However my methodologies indeed include pro-active smoke detection systems, room temperature changes, visual checks of the structure, and my conclusion is that nothing is burning and nothing is on fire.  In 2018 we indeed have some conditions which will require that we remain vigilant and alert, but for now  I am staying where I am at.  Let’s take a closer look via my opinion based analysis….

A couple of potentially negative things exist in “the background” right now:

  1. FOMC Chairperson hand off, Janet Yellen passing the baton to new chief, Jerome Powell.  Yellen’s last day was Friday.
  2. Never-ending political turmoil at seemingly all levels.
  3. Expected interest rate hikes in March 2018 (FOMC Meeting March 20-21).  This is the leading cause of heartburn in markets.
  4. Some major Dow and S&P index components reporting less than expected quarterly earnings.
  5. Depending on who you ask, an “overextended bull market.”  Others, myself included, believe we may be entering a new uptrend phase and we may see another 1-3 years of gains.
  6. Weak US Dollar.

Now, some positive:

  1.  The Dow Jones loss on Friday represents a 2.5% negative performance.  Point loss was big, percentage loss was not.  In comparison, the Dow Jones lost 22% in one day during the famous 1987 market crash.  Percentage-wise, the loss on Friday, while not desired, was not a big deal.
  2. SP-500 Index had its best January one month return since 1997.
  3. January “sets the tone” for the rest of the year, 95% of the time (chart below).
  4. All indexes above their 50-Day moving averages.
  5. Sell-off volume was not hugely above average levels.

Lets talk about the above points some more.  I will not hit on every one, as most are already self-explanatory, but some need elaboration.  Lets start with the chart of the January’s of prior years.  This chart is from Jeff Hirsch, of the Almanac Investor.  I happened to meet Jeff in person at a Dallas,TX investment meeting two weeks ago; I asked him a couple of questions- turns out he and I both share similar bullish views about 2018.  He is a cool guy and knows his stuff.  The red strike-thru is my edit, as the graphic was last updated on January 26.

Going back to 1950, a strong January sets the tone for the remainder of the year at an approximately 95% success rate.

We indeed had some big name, major, companies report less than expected quarterly earnings.   Google recently reported that their Cloud Platform revenue is way behind expectations, competitor Amazon, with a similar cloud platform, is outperforming revenue-wise Google 5 times.   Google is a MAJOR NASDAQ stock and this dragged things down.  Apple, another major stock, is seeing lackluster Iphone-X sales.  If you didn’t know, the Iphone-X is not much (if at all, unless you are a Mac Addict and Iphone nerd) different from the Iphone-8.   Apparently, the millennial generation (well, probably everyone….) has some heartburn paying $1000 for a Iphone-X (43% costlier) that offers enhancements and improvements over the Iphone-8 of basically zero.   The press and analysts are questioning Apple’s business decision, and the stock is down.  (This is not an Iphone review, so…)

Let’s take a look at some charts:

You will see that the SP 500 index is indeed “overextended some”, a term popular with the financial media, describing when the index departs from its 50-day moving average and other trend-lines.   Note that it still remains above the 50-day, which is approximately 2730.   2730 is an important level.  Any close below 2730 is cause for some alarm.   

In regards to the weak US Dollar and its impact on stocks, ask 20 economists about this and you will get 20 answers.  The theory that “a weak dollar makes international stocks go up” is questionable.  Many believe the weak dollar is a result of international stocks moving higher first, as money goes into overseas investments and non-dollar currencies, causing the dollar to fall.   “Moving to I-Fund because the dollar is weak” probably should be opened up a little more to include consideration of other factors.  My opinion.  Just remember the dollar is a currency, the stock funds are stocks, two different animals.  Keep in mind the world markets are just that:  global in nature.  Toyota (Japan), Samsung (South Korea), Airbus (France), have factories and subcontractors all over the world, and sell to customers all over the world.   The “Japanese” Nissan Titan pickup truck ?  Built in America and sold in America.  Korean Samsung TVs?  Sold in Mexico.  If Toyota Camry’s suddenly fell apart after 1 week of ownership or had a series of gas tank explosions, Toyota stock would go down, weak dollar or not.  Toyota is a Japanese company- Japanese stocks represent 24% of the MSCI-EAFE Index, which is what the I-Fund is based on.  The point here is that the US Dollar, alone and by itself, is not what causes the I-Fund to move up or down, in my view.  Strong Corporate/company performance, quality products, and solving problems are typically the companies whose stock prices go up, no matter what country the HQ is located in.  Some have different interpretations and view things via a different lens, that is fine, I am sharing my opinion, nothing more.

If interest rates rise this year, the US Dollar is expected to recover.   Also, Mr. Trump’s approach of de-regulation, tax reform, and bringing business back to US soil is an approach never seen in history; the resulting effect on the US Dollar is not known, nor will it be seen for 6-12 months.  In basic terms, the US Dollar weakness is probably attributed to the belief that tax reform will result in reduced tax revenue to pay for government programs and financial obligations, thus impacting our economic health as a nation, and it is also weak due to investment taking place overseas.  Money leaves US stocks and currencies (USD) and goes elsewhere, in pursuit of higher returns, especially in China.  China, the world’s factory, does pretty good when the world is doing good.   In the end, our American Greenback has fallen in value.  I am not running a FOREX site or economic think-tank (both are beyond my expertise) so I will stop there.

The main driver, in my opinion, of market panic is the expected interest rate hikes.  However I believe that the multiple efforts by the current administration, on all fronts, to stimulate business growth and effect tax reforms, will mute any negative impact that rising rates will have.

In summary, let’s monitor things but I see last week’s action as panic driven.   I also feel we are in a never-seen-before environment of pro-business politicians, tax reform, and de-regulation.  All economic indicators appear positive.  I feel very confident about 2018.   Let’s keep an eye on SP-500 level of 2730, any close below that, well maybe multiple closes, and I will start to stay up at night.

My TSP Allocation/Contributions remain unchanged.

Thanks for reading….talk to you soon….

-Bill Pritchard