Hello Everybody-
Bottom Line Up Front: My TSP Allocation/Contributions remain 50% C-Fund and 50% S-Fund. NOTE: The I-Fund may outperform one or both US based stock funds this month, however my personal preference is to remain US-focused for now.
My last post, 30 days ago, discussed the volatility in the markets and how the markets are mostly reactive to non-economic events. Panic and fear seemed to be the rule of the day. Unfortunately, practically nothing has changed since that post, hence this somewhat delayed “update” 30 days later. I was hungrily waiting for a new event, a new development, to catapult things in a new direction. Nothing, to include my TSP allocation, has changed since my last post. The following events have occurred, all causing varying degrees of fear and panic and subsequent volatility:
March-13: Chief Economic Advisor to President Trump, Gary Cohn (former Goldman Sachs) resigns. Cohn was of the anti-impose-tariffs mindset. He did not want tariffs on China. Cohn was replaced by Larry Kudlow, thus mitigating some Wall Street acid reflux over Cohn’s departure. Same date: last day for Secretary of State Rex Tillerson.
March-20,21: Federal Open Market Committee (FOMC) convenes. We later learn that three rate hikes could occur in 2018 and that the FOMC believes the economy is doing very well.
March-23: Tariffs “take effect” this day, having been publicly discussed weeks prior.
April-9: National Security Advisor McMaster leaves office
April-11: House Speaker Ryan announces that 2018 will be his last year as member of House. Ryan was an anti-deficit, reign in government spending guy.
April-13: Military action by US, UK, French forces with 105 bombs dropped on Syria.
Can anyone blame Mr. Market for having some indigestion lately? Let’s take a look at recent market action as I make my case for my continued equity/stock exposure. To be clear: I do not see the G-Fund in my near future at all. Let’s talk about this….
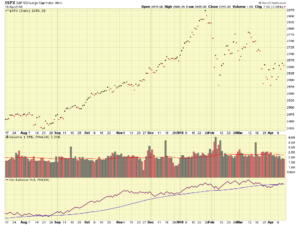
Note that the SP-500 Index, my “default market thermometer” has been so volatile that this update will use “Close Only Prices” (the price of the index when the market closed). This will remove the intra-day price swings from the chart and give a (somewhat) clearer picture of the action. Chart below:
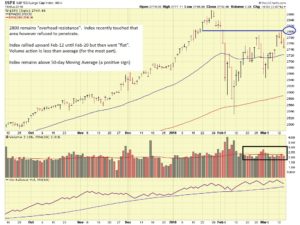
You will see that short-term (going back a few weeks), the “overhead resistance” is 2675, while longer term overhead resistance is 2800. Operationally, this means when you watch CNBC’s ticker symbols, if it closes above 2675, that is great, however save your celebration as we need it to close above 2800. Note that “support” is located at 2575. We do not want any closes below this level. As I have said earlier, the Dow Jones is only 30 stocks (mostly larger industrial-oriented companies aka oil/gas, construction equipment, etc) and they do not necessarily represent the entire stock market. The business media likes the Dow because triple digit point swings make great headlines.
A positive observation is that volume has been subdued (mostly) for the last few weeks. Indeed, whipsaws and swings have occurred, but volume is the “powder” behind the shot, low volume typically reflects weak moves which may not last. Heavy volume is typically associated with large hedge funds, mutual funds, TSP/State Retirement plans, who are buying large positions. When the volume is below average, especially on a sell-off/down day, it can be concluded that the “Smart Money” is hanging tight. See article: https://www.investors.com/how-to-invest/investors-corner/how-to-spot-institutional-accumulation/
To continue my dissertation, let’s take a look at Gold Prices. I have said in numerous prior postings that many consider Gold to be a “safe-haven” investment.
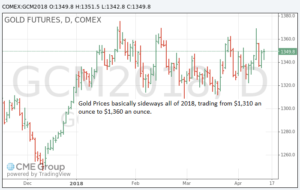
With that said, Gold has basically been flat for the last 30 days. It spiked somewhat when Syria was bombed, but rolled over and went back down in the next trading session. See chart:
Visible is that Gold has traded between $1,310 to $1,360 an ounce. Note we already made the observation that the stock market volume has been below average, meaning the “smart money” has not left stocks. If they did (and if my theory was not correct) you would see (or probably would see it) show up in Gold. However gold prices are fairly tame and subdued. “Nothing to see here….”
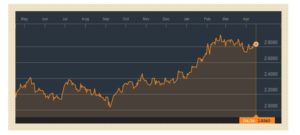
Recently some attention has been given to the 10-year Treasury Yield. This tends to go up when inflation is feared. The financial press is calling the 3% level a key psychological area. 3% yield or higher and we could witness the stock market going down, how much is anybody’s guess, largely due to black box trading computers which may be programmed to sell if 3% is attained. The current yield remains below 3%:
The next event/date that I will be watching is the International Monetary Fund (IMF) World Economic Outlook release on April-17. Expect to see tariffs, inflation, and the global economy to be the key themes. The IMF is a good “second set of eyes” beyond our own federal government published data and documents, such as the FOMC, Bureau of Labor Statistics, Dept. of the Treasury. It will be interesting what observations the IMF has on April-17.
As stated earlier, my TSP Allocation/Contributions remain 50% C-Fund and 50% S-Fund. Expect another update in the coming weeks, however if there is nothing to report, then there is nothing to report. Let’s hope that the market turbulence subsides and a renewed uptrend commences.
Thank you for reading. I appreciate all the emails and messages, which rightfully tend to increase when the market volatility increases. My updates often reflect recent questions sent to me, I believe I have touched on most of them on this update. Please continue to share this site with your friends and coworkers, and keep Dan Jamison (The FERS Guide) in mind for the benefits and FERS system questions you may have.
Thank you again and talk to you soon !
-Bill Pritchard


