
Hello Folks
I have not been on writer’s hiatus and admittedly I should not have allowed almost 1.5 months to go by without an update, however I have only reached a point now where I feel a new post is warranted. Not many things have changed in the markets, except that summer is indeed over and I can only hope that the trends of the indexes change back upward. Bottom Line Up Front: I remain 50% S-Fund and 50% C-Fund. I do have some opinion-based concerns, which I will touch on below. Did I say they are my opinion ? Continue reading.
The I-Fund continues to be the lagging performer as far as stock funds (Lifecycle funds not counted) are concerned, both Year To Date (YTD) and on a last 12-month basis. As we enter month #9 of the calendar year (September), it is pretty apparent (to me) that the I-Fund is not going to “come around” anytime soon. Even if it does, it is unlikely to outperform the S/C Funds in the last few months of the year. My end of year prediction is the I-Fund will be the worst performing TSP all-stock fund for 2018.
I am thankful that I have been in S/C since December 2017, being fully invested in the top two performing funds (out of ten choices) for all of 2018 so far.
Let’s take a quick look at the TSP return data:
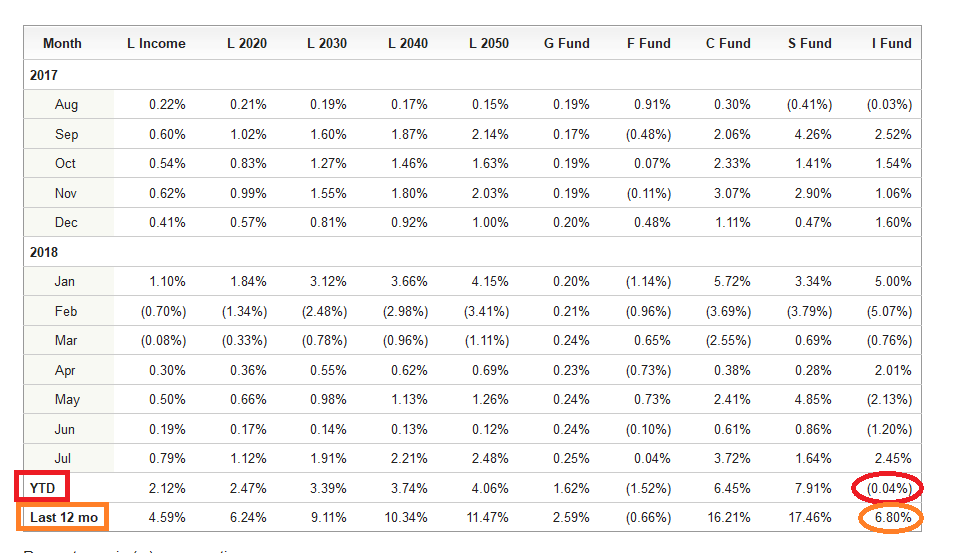
As discussed previously, the I-Fund is suffering due to the US Dollar’s strengthening (not a bad thing…) and various new US federal policies and initiatives to deregulate and improve the US business climate, all of which will benefit US-based companies, versus international ones. The C-Fund is lagging (not hugely) because many large cap companies, aka Boeing, General Electric, Exxon, are exposed internationally due to their business portfolio. If the Asian economy is suffering, Boeing may sell fewer airplanes. Hence you see the C-Fund lagging the S-Fund.
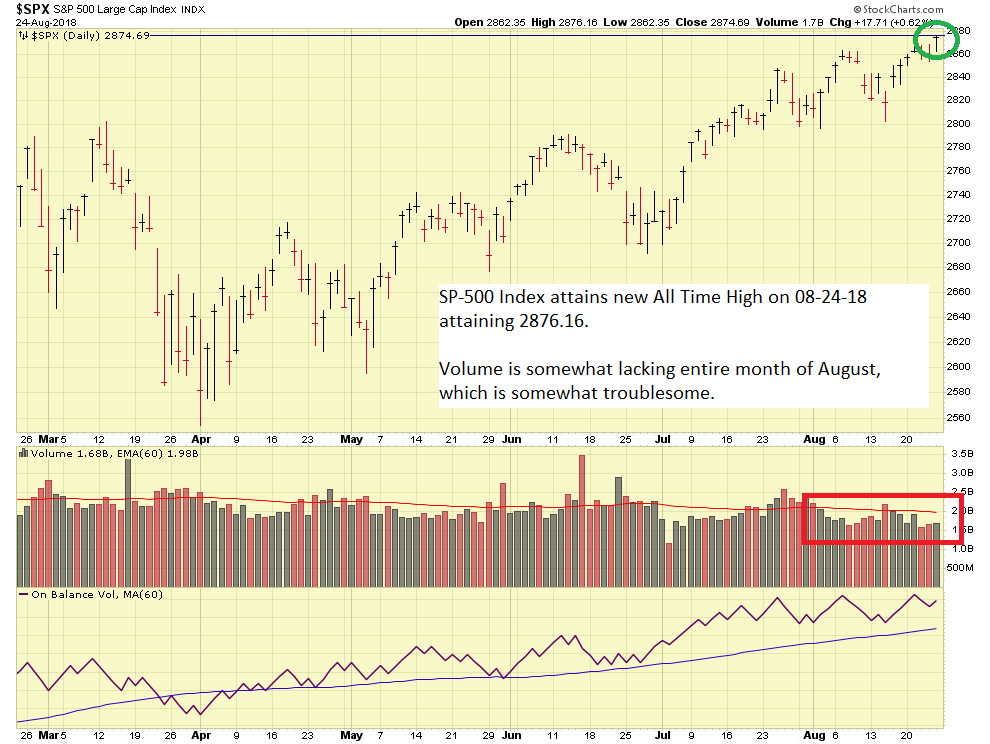
The SP-500 Index attained a new All Time High on August 24, reaching 2876.16. However as you can see in the chart below, volume action for the entire month of August was lackluster. This is not desirable, as volume is the horsepower behind price action. This can be attributed to summer trading, as I have noted in prior posts, the “summer doldrums” occur when many traders throttle back trading and opt to take vacations from the market during the summer. However without volume, the action will not be “propped up” or sustained, and will fall back down like a weak bottle rocket. It is my hope that volume promptly returns to the market- if not, we may see trends become unsustainable.
On August 22, 2018, the Federal Open Market Committee (FOMC) minutes were released, and on August 24, FOMC Chairman Powell stated that the economy is strong and while inflation is rising, inflation is not a concern. While this may be correct, as someone who will rely on the TSP to be an important component of his retirement, I see some concerning things appearing in the distance:
Rising Inflation (as measured by CPI data)
Inflation indeed is rising, whether this is short-lived, or a longer-term situation, is yet to be known. As FOMC Chairman Powell stated, he is not concerned (yet). However using the below CPI chart, we see with our own two eyes that it is going up:
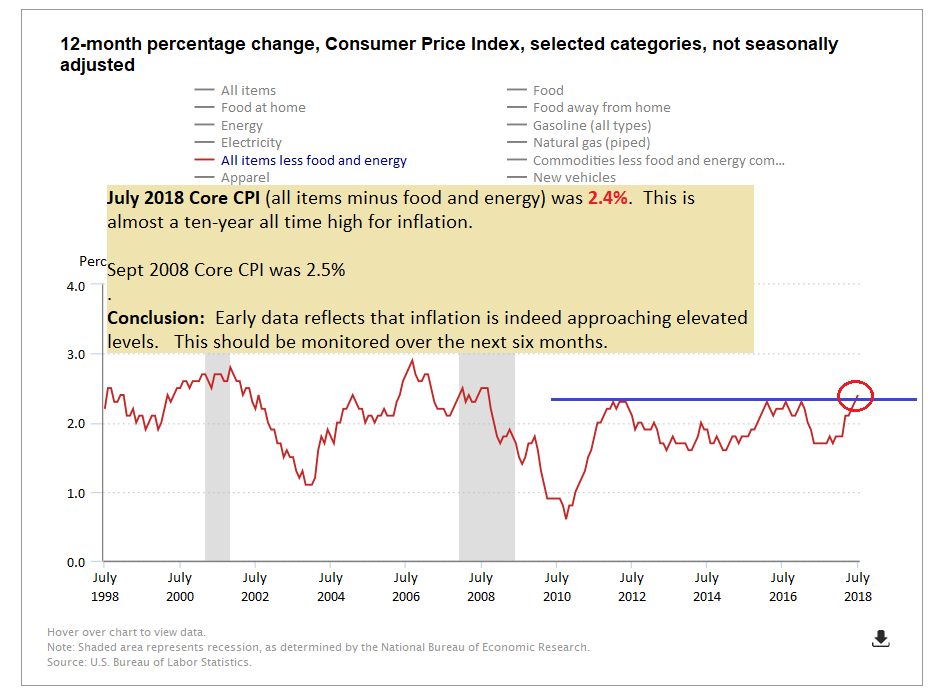 July 2018 CPI (minus Food and Energy) was at 2.4%, an almost ten-year high. Ideally it goes down in the next reporting cycle, or does not continue to go up. Continued increases over the next three to six months would not be positive for the stock market.
Housing Market possibly getting Soft(er)
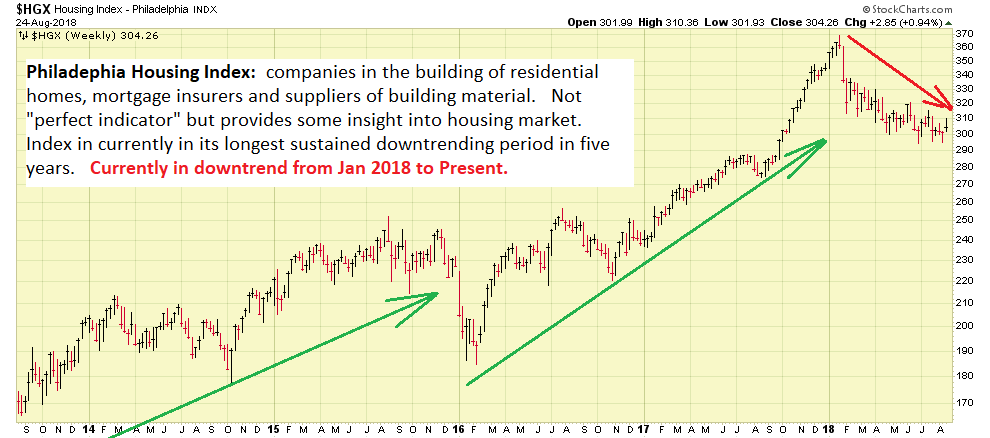
The housing market, at least based on early, preliminary research by me, appears to be getting soft. The Philadelphia Housing Index is an index that tracks approximately 20 companies that work directly in the construction market of the United States and is composed of companies in the building and prefabrication of residential homes, mortgage insurers and suppliers of building material. The index is in its longest continued downtrend (lasting 8 months, having commenced in January 2018) in over five years:
Is this short-lived ? I don’t know but it is likely rising interest rates are impacting the mortgage market and the trickle-down effect is that some borrowers are opting out of buying a house until rates come down a little bit. A chart of current US average 30-year mortgage rates is below.
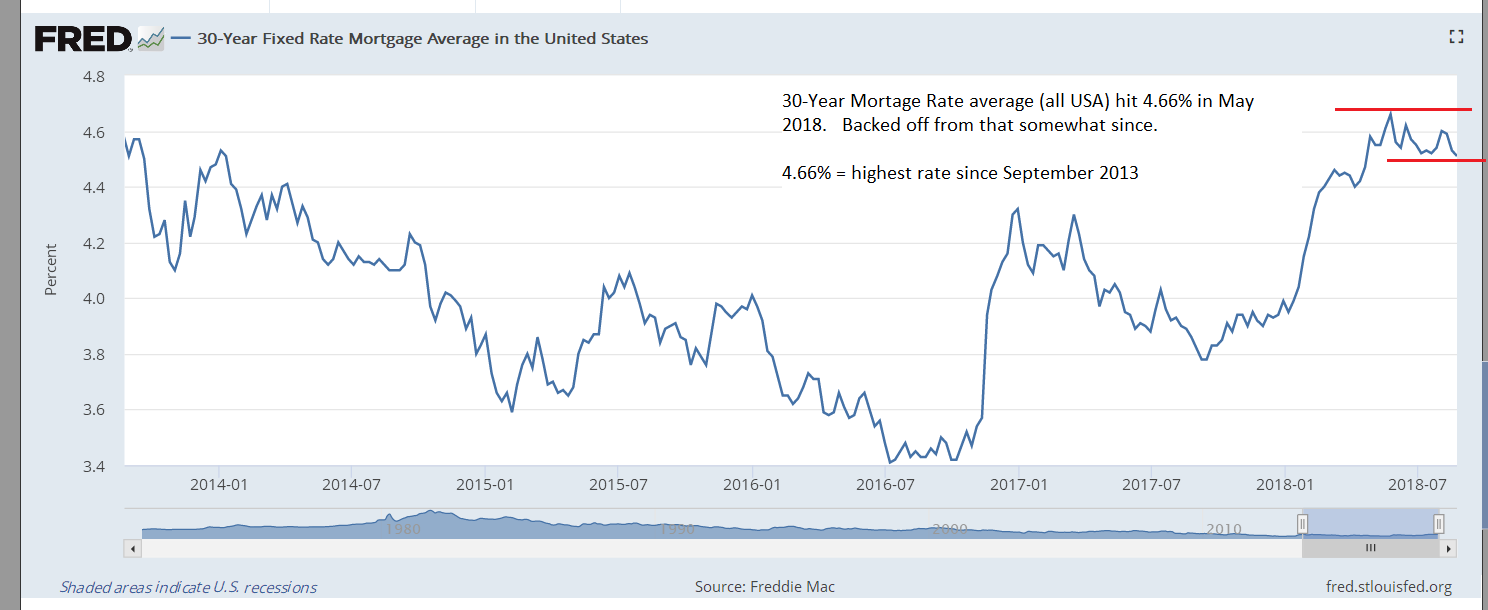
The housing market and related sectors bear watching, sustained, ongoing weakness in those areas may be a harbinger of a weakening stock market.
Yield Curve Flattening
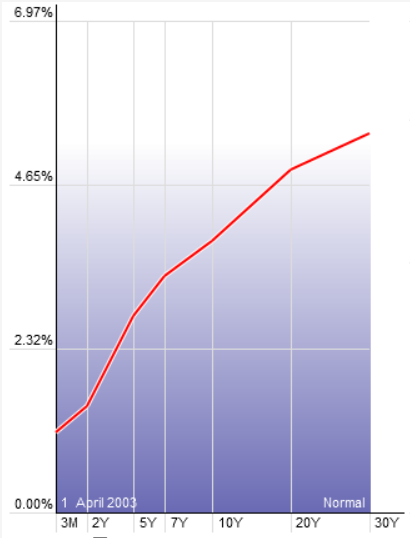
The “Yield Curve” is a line that plots the interest rates, at a set point in time, of bonds having equal credit quality but differing dates of maturity. Plotted graphically, the physical appearance of the Yield Curve is an oft used signal for predicting recessionary climates, and stock market crashes. The below Yield Curve (observe the angle) existed during the early stages of the 2003 Bull stock market.
The current Yield curve is below. Compare the appearance to the 2003 Yield Curve above.
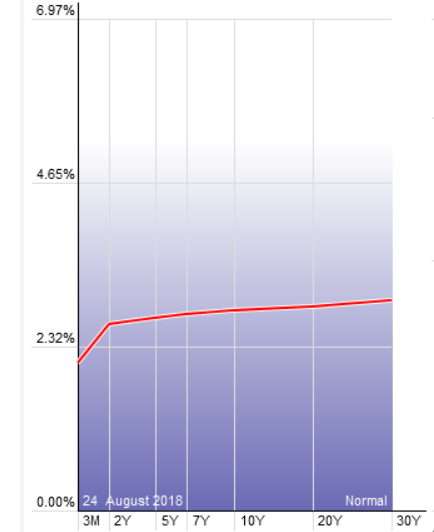
A “flat Yield Curve” is historically associated to uncertainty ahead. An inverted Yield Curve is typically believed to be a reliable predictor of a recession. Some believe that things “are different today” in light of the FOMC’s quantitative easing and other things, yet others place high confidence in this indicator. In summary, flattening and inversion of the Yield Curve is clearly a yellow caution light for the investor.
The Market Itself
The most important indicator, the market, continues to make new highs. However in my opinion, we need to put both hands back on the steering wheel, adjust our driver’s seat, bump the cruise control off, and be alert as we enter the final months of 2018 and transition into 2019.
Thank you for reading, and if you find this update useful, please share it with your friends and colleagues. My personal TSP Allocation remains 50% S-Fund and 50% C-Fund.
-Bill Pritchard
