Good Evening Folks
Well, the clock is ticking and we are less than one hour until midnight Washington DC time. Public news reports reflect that no agreement has occurred, and thus it is my responsibility to advise you of my opinion regarding the shutdown and its affect on the markets and ultimately our TSP funds. Note that I have received multiple emails on this topic, I am not ignoring you, but this post should touch on most questions posed in those emails.
Let us observe that the last shutdown was in 1996, which lasted three weeks. This is still fresh in my memory, as this occurred while I was a young Border Patrol Agent. I recall being at “muster” (roll call for some other departments), and learning about the shutdown and what would happen. Flash forward to 2013, and we have another shutdown looming, less than one hour away.
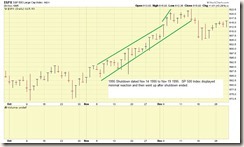
While the markets did sell off today, 09-30-2013, this was mostly panic selling in my opinion and not reflective of bigger problems with the economy. Anyone who thinks the economy is still bad should try to travel via airline, as every seat is filled with both business and tourist travelers. Let’s take a look at the SP 500 charts during the 1995-1995 time frame. As a point of reference, we had one shutdown Nov 14-19, 1995, and another one Dec 16 1995 until Jan 6 1996 (what a great way to celebrate the holidays) .
The chart above shows the SP 500 index during the Nov 1995 time frame. The index barely hiccupped and went up the entire month.
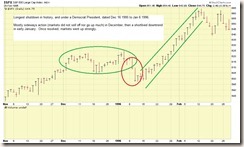
This chart, above, shows the SP 500 index during the longest shutdown in history, lasting Dec 16 1995 to Jan 6 1996. As can be seen, the index was mostly flat in December (not completely abnormal, the markets tend to be quiet anyway due to the holidays), then went down in early January (as traders returned from the holidays), then went up strongly once the shutdown was resolved. OBSERVATION: the markets did not “crash hard” nor did the world end because of the shutdowns. Granted, in 1996, the NASDAQ and other indexes were going up like bottle rockets, and possibly this prevented any negative responses to the shutdown.
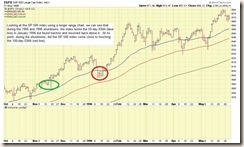
The chart above is a longer term view, displaying most of 1995 to 1996, allowing the viewer to see the overall behavior of the index. As my notes on the charts indicate, at no point during the shutdown dates did the SP 500 index come close to touching the 100-day EMA, and only broke the 50-day EMA during the Jan 1996 timeframe. Once the shutdown ended on Jan 6 1996, the markets went back up. OBSERVATION: Any behavior BELOW the 100-day EMA is a warning sign however a potential breakage of the 50-day EMA must be looked at with history in mind. It may not (or may be) a sign of worse things ahead.
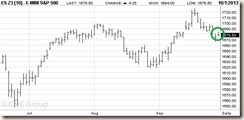
As an aside, the SP 500 futures, chart below, are trading up, versus down, which is interesting, in light of the shutdown occurring in less than 30 minutes.
SUMMARY: I remain in S-Fund and my opinion is we should watch how things play out. With history displayed above, we can panic a little less due to the shutdown. I will try to react to the market itself, and will not try to out-guess it, and if the market flashes red flags, then I will move to G-Fund. Yes, I have been wrong before. However, again, with history lessons of the past in my mind, and a close eye on things everyday, I am not panicking. Yet…..
As always, thank you for reading and if you find this site useful or informative, please share it with your friends and coworkers.
– Bill Pritchard


