Monthly Archives: August 2013

Updated FERS Guide by Dan Jamison

I wanted to update everyone that Mr. Dan Jamison has released an updated FERS Guide, edition 7.3, released on August 19, 2013.   Every federal employee should have a copy.   If you need retirement or benefits information, he is the “go-to guy” for that.

I feel fortunate to be able to reach out to Dan, to answer benefits questions that sometimes come across my desk.  I am also proud of the fact that my site, The Fed Trader , is mentioned in the FERS Guide.

Dan will present a 90-minute session at the 2013 FLEOA National Convention, in case anyone wants to meet him.  All material in the FERS Guide is written and produced entirely by Dan.   Please use the “FERS Guide” page on this site to locate the recent editions.   Thank You.

– Bill Pritchard


Aug 27 Update – War and Markets / after-action look

Hello everyone

Today witnessed the market’s response to possible military strikes on Syria.  As is typical when people respond in an emotional, panic-like state, their response is sometime without the benefit or consideration of planning or study.  As they say, hindsight is always 20/20.  Lets use some of this hindsight and take a look at war and markets.

Allow me to display two charts of the SP 500, one showing the 1991 time period (US military planes attacked Baghdad on Jan 17 1991), and another one showing the 2003 time period (US military forces launched attacks on March 19 2003).    I was unable to bring up charts prior to 1991 (such as WW-II, Vietnam, etc) but in summary, previous research has demonstrated that stock markets commonly rally, when the US gets involved in military conflicts.  It can be further said that prior to US invasions, markets are typically in panic mode and/or declining.

Flash forward to 2013, and a strike on Syria is being mentioned on the news.  Syria is akin to Iraq in many ways.   Banned devices/materials.  Civilian population being attacked by their own military.  Middle East country.   No identifiable useful export besides the mass production of problems and headaches.   Same song, same dance, the only thing different is who is on the dance floor.

How do we respond to the sell-off on Aug 27 ?  That is probably the “question of the day.”   Please see attached charts.   In light of my jumped-the-gun response regarding North Korea, in which I went to G-Fund, only to see the markets then go up, I am going to “hold position” in S-Fund right now.  The North Korea situation was the threat of nuclear strike against the US, and in the absence of market data regarding strikes against US soil by other countries, I elected to move to G-Fund.    No harm/no foul, but I must admit I got nervous and moved to G-Fund.

Starting to ramble…long story short, see charts….personally I am staying in S-Fund for the time being, and trying to keep emotions and nervousness away from my decision-making.

SP500-1991-COMMENTSSP500-2003-comments

Thank you for reading.  If you find this site useful or informative, please share it with your friends and coworkers.  My TSP Allocation remains 100% S-Fund but obviously this is subject to change.

– Bill Pritchard


August 18 Update – Markets displaying weakness

Hello everyone

After the past week’s disappointing market action, I have decided that chewable Pepto Bismol is much better than the liquid version.   With that said, the indexes are showing weakness and we need to keep our trigger fingers close to the G-Fund trigger guard.   I am not moving yet, but I am closely monitoring the moving averages and trend lines.  One intermediate Moving Average that I use is the 75-day, any activity below this is almost a sure red flag and G-Fund signal.   See charts below, one without comments, one with comments.  The 75-day moving average is the red line.  This is used in conjunction with other data, however it’s usefulness becomes apparent by looking at the charts.

SP500-08-18-13SP500-08-18-13-comments

As you can see, we had some prior weakness occur in late June, however the market recovered and things rebounded.  As we enter August, we are yet again seeing some lack of headway.   It should be noted, that historically, August, September, and October, are the market’s worst performing months.  So, what does this mean ?   This means we are faced with the questions:  Should we disregard this poor August performance, and consider it “ops normal”, and continue forward in stock funds ?   Or should we consider this the end of the world and go to G-Fund ?    Due to my inability to predict the future, I am forced to utilize my charts, historical market notes and experience, and mathematical models to make decisions.  Cable business news shows will spend all of their broadcast day trying to answer the same questions.

In summary, one thing is for certain, the markets are displaying weakness, and a move to G-Fund may be in the near future.   Let’s see how this week plays out.

Thanks for reading and please share this site with your friends and coworkers.

– Bill Pritchard


August 11, 2013 Update – 100% S-Fund continues

Hello everyone

The market’s action this past week resulted in the streak of gains (six weeks worth) being paused.  This is not a big deal…July historically tends to be a lethargic trading month in the markets…our July 2013 gains were really a pleasant surprise.   Hence, this “pause” in the market’s uptrend is not causing me to lose sleep.

It is noteworthy to reflect that July’s gains (again, typically a lackluster month) resulted in the S-Fund being the top performer for the month, something I talked about in my July 26 post on this site.

It should also be noted that the I-Fund has indeed taken the lead over the other funds, a behavior which began approximately the last week of July and exists until now.  I am not going to change my TSP allocations yet, as I want to monitor this behavior a little longer, but it is something that we need to be cognizant of.   One could speculate as to why this is happening…some folks believe that the global economy is starting to strengthen, thus prompting some cautious investments in the foreign markets, and thus pushing the foreign stocks higher. 

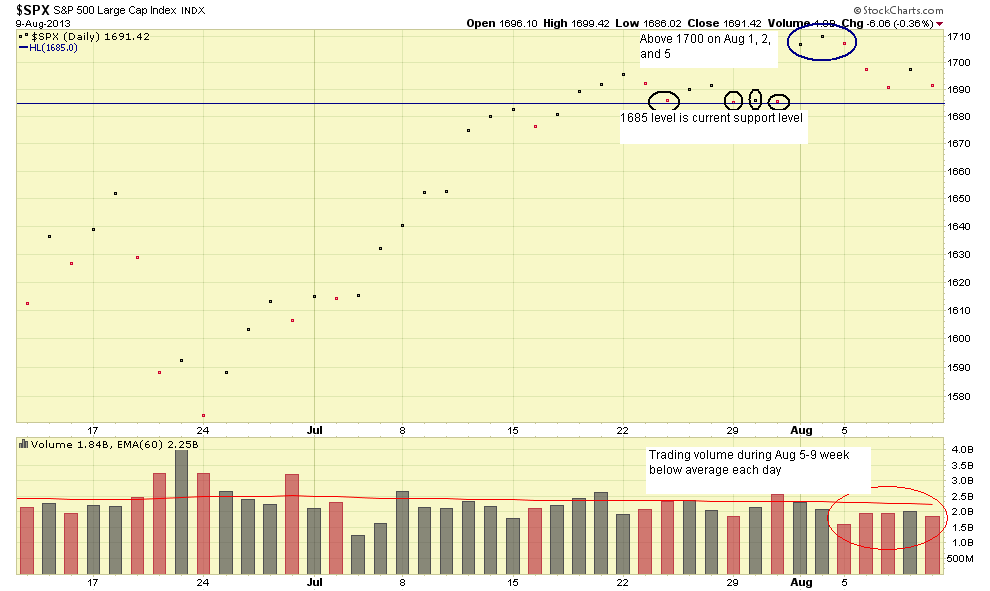
The most recent trading week, August 5-9, was marked with some nervousness after Chicago Fed President Charles Evans’ Aug 6 comments, which signaled a possible scale-back of the Fed’s financial stimulus program.  The next Federal Reserve meeting is Sept 17-18, at which time we may see more clarity on that issue.  As discussed previously on this site, I consider the US economy a “sick hospital patient”, and as the patient recovers, it only makes sense to reduce the prescribed medications and various life support systems which are attached to the recovering patient.  Clearly some folks are worried if the patient will survive without medication and life support.  However, it is better in the long term if the patient learns to breathe on his own again.  

Let’s take a look at a 2 month chart of the SP 500 index, using “close only prices”, to see how things look.  I am calling 1685 on the SP 500 as our support level, as all the recent market closes seem to be at or above this.  I am happy to see that the SP 500 broke above the 1700 level, an area discussed in my July 26 post, as being a key overhead resistance area.  This occurred on Aug 1, Aug 2, and Aug 5, and returned to sub-1700 levels after that, largely due to Mr. Evan’s comments on Aug 6.   Let’s take a look at the chart:

 SP500-08-09-13

In summary, I am still 100% S-Fund at the present time, and will monitor the I-Fund to see if a change is warranted in our TSP Allocations.  Note that August and September are typically the worst performing months of the entire calendar year, so any declines during August and September may or may not be a departure from typical historical behavior.

As always, if you find this site useful or informative, please share it with your coworkers and friends.

Thank you for reading

         Bill Pritchard