Monthly Archives: July 2013

July 26 Update – 100% S-Fund continues

Hello everyone

Just a quick note that things, as I see them, are in my opinion “ops normal” and I am 100% S-Fund in my account.  This week, my indications are that the I-Fund outperformed the other funds on a one-week basis, however I am not basing any trading decisions on this one week performance.  My data indicates that the S-Fund is the overall July winner (so far).

The indexes are reflecting “cautious” accumulation, in which more money is coming into the market versus money going out, with the NASDAQ (a tech heavy index with many up and coming companies), performing well.  I say cautious because July witnessed some down days…large investors are not jumping into the market with both feet.  In my opinion some Bernanke nervousness and other things are still in the air, affecting enthusiasm.

My charts of the SP 500 index reflect a potential Cup with Handle pattern forming, which is a pattern discussed by William O’Neil of Investor’s Business Daily, associated with bullish behavior.  The particular pattern underway now is NOT a perfect cup with handle, but in my opinion, it is closer to being a Cup with Handle than not being one.  Please see images below

Tea_Cup_Design_by_rafibashir79

SP-500-07.25.13

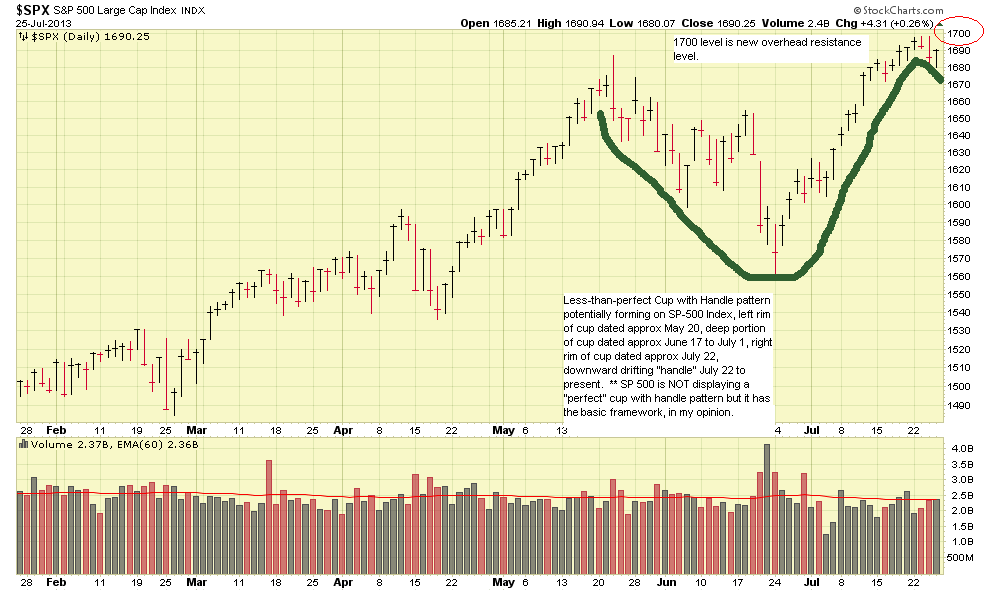
Another observation that I have, is that the 1700 level on the SP 500 appears to be our new area of “overhead resistance”.  Any activity at, and above this, will  make the headlines as this is a new All Time High and the area of resistance.  The SP 500 hit 1698 on July 23 and July 24 than cooled off somewhat and came down from those levels.   Keep an eye out for 1700.

1670 is our support level and anything at and below this is undesirable.  On July 11, the Sp 500 had what I call a “thrust day” where its intra-day performance was much better than the prior days, with the index closing higher than the prior day.  This is akin to a person whose max bench press per workout is 200 lbs.   For five days he maxes at 200 lbs each day and on Day-6, he is able to magically bench 300.   The next few days after that, he is lifting 200, 240, 220, 205.  However you now know that 300 is possible.   That is what I see in the indexes.   Some one-day bursts of strength, a few flat days, another one-day burst, etc etc.  The summer months July-Aug-Sept tend to be lackluster, so I am happy to have July’s gains.

With that said, I remain 100% S-Fund in my account.   I will update folks as the situation warrants.   I ask that if you find this site useful or informative, please pass it to your colleagues and friends.

Thank you

– Bill Pritchard

July 11 Update – return to 100% S-Fund

Hello everyone

Arriving to the end of the first complete trading week after the July-4 holiday, I am happy to announce that the markets have closed higher each day, than the prior day, and are exhibiting the signs of a resumed uptrend.  The volume is not as high as I would like it, but the behavior across multiple days gives me the confidence to return to the S-Fund.   This week, the I-Fund actually outperformed everything else, but I am still a little skittish about the international markets in light of still unresolved issues internationally, such as Egypt, Syria, the Greece economy, etc.    If things settle down, I may be inclined to invest in the I-Fund.

No cool graphics today, just my opinion that G-Fund “safe haven” is no longer needed and it is safe to resume investments in the S-Fund.

Thank You.   Also take a look at the FAQ as I will be updating it over the next few days due to some good email traffic sent to me.   Lots of folks with great questions.

Thanks for reading….please share my site with your colleagues and coworkers if you find it useful or informative.

– Bill Pritchard


July 8 2013 late PM Update

Good Evening

A very short update, as I want to see how this week shapes up.   On Monday, July 8, the market participants returned from the holiday with plenty of enthusiasm, sending the indexes up, on above average volume.  The SP 500 closed at 1640, which is an excellent sign, and ten points above our prior overhead resistance level of 1630.   July 8 price action resulted in a “gap” in which the low of July 8 was higher than the high of the previous trading day (July 5).  This results in a “gap” on the price chart.   This is a result of intense buying and accumulation, all of which are positive for the market.

Please stay tuned for another update later this week, as I want to see how the market does over the next few days.  However, this is a positive start to the week.   Lets keep our fingers crossed that it is not a one day fluke (I doubt it is…)

Thanks for reading

– Bill Pritchard

July 2 late PM Update – TSP Allocation 100% G-Fund

Hello to everyone

This week began on a positive note, with the SP 500 and other indexes closing up on Monday July 1.   The trading volume was not as high as I would have preferred, and as such, these “up moves” have questionable credibility.   Volume is the horsepower behind the move, and it is not where it needs to be yet.  The perfect day is an “up day” (end of day closing price is higher than the start of day price) on above average volume, ideally 25% (or more) above its average trading volume.  These two things, when occurring during one trading day, is a positive thing.  Not one, not the other, but we need both.

Note that this week will likely see light volume the entire week, due to the July 4th holiday and reduced trading activity this week.

My personal observation is that we are looking for the SP 500 index to CLOSE at or above 1630 on multiple back to back days in order to believe that any new upward movement in the indexes are for real.  Let’s see how the next week or two play out.   It should be noted, that the months of July-August-Sept are historically (absent a few occasional deviations from this trend over the years) the worst performing months of the year.   What does this mean?  It means that if July 2013 is “down”, this does not mean that the world is ending.   Historically, July (and August and Sept) tends to be down.   Of course, we let the market tell us what to do, and if Mr. Market decides to give us great returns in July, I am not going argue and will take what he gives me.

On July 2, the indexes performed well during most of the day, then turned downward in the afternoon, with the SP 500 closing below the 50-day Exponential Moving Average (EMA), which is a key trend line, to help determine trend and health of the market.   The 50-Day EMA is 1611.   This EMA will change as the days ahead progress, but for now the thing to be aware of is that a “close” (last price the market traded at when it closed/stopped trading for that day) near or below 1611, is not desirable.

Let’s take a look at two charts of the SP 500 Index, one with a 3 month view, and the second chart being a 1-month view, with my comments.

SP500-07-02-13

SP500-07-02-13-II-comments

I am personally still “long” (holding stocks that I bought) in my personal brokerage account, and since they are still doing relatively well, I have held on to them.  However, my TSP Allocation is 100% G-Fund.  I will monitor things and advise everyone as warranted.   I recommend everyone watch the SP 500 index and keep their eyes out for activity at or above 1630.    The remainder of the week will likely be low trading volume and thus, whatever happens, is probably not worth considering for our decision making.  If you turn CNBC off the rest of the week, you probably won’t miss much.

Thanks for the interest in the site, and if you find the site informative or useful, please pass it to your friends and coworkers.   I have received quite a few nice emails this month, thanks for those.

Take care everybody

– Bill Pritchard