
Hello Everybody
Unfortunately my personal TSP Allocation remains 100% G-Fund. Indeed I am risk averse, and possibly closer to retirement than others in my subscriber base, however allow me to provide my opinions regarding my decision. You may recall prior posts regarding my concerns about the US/China trade talks- it is expected that tariffs on $250 Billion worth of Chinese goods will go into effect on October 15 (these were originally planned for October 1). Being that numerous banking experts, Fortune 500 CEOs, and various economic indicators all are nervous regarding the tariff situation, I am taking a watchful-waiting stance, yes it is painful to see potential gains go unrealized in my account. Let’s talk about some of the things that I am watching.
Starting with the primary, gold standard indicator, the market itself, we can see that the S&P 500 has indeed climbed in recent months but volume has been mostly below average. As has been mentioned numerous times in the past, volume is the rocket fuel that powers any move. Volume is currently unimpressive and lethargic, see chart:
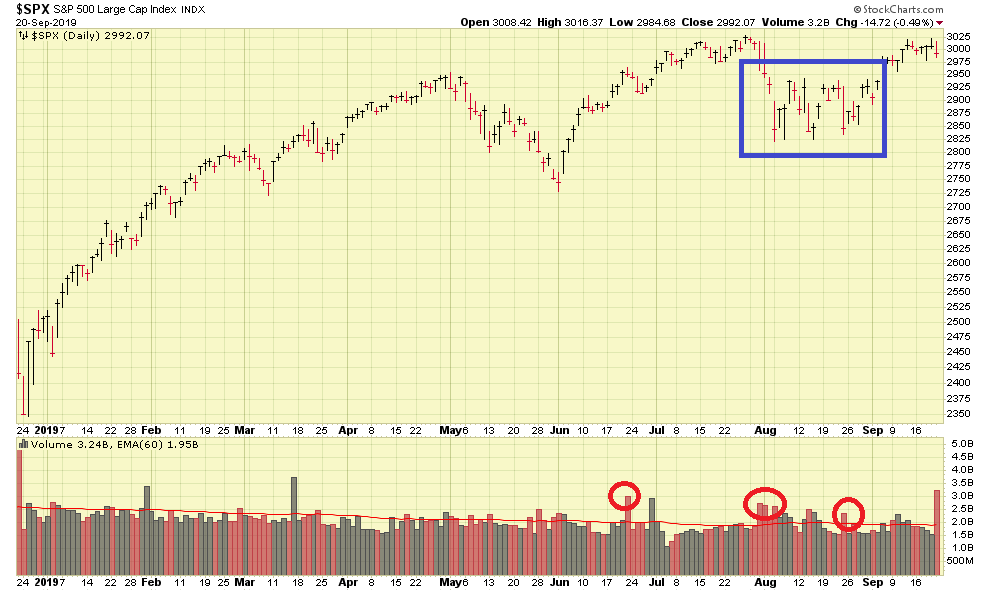
As can be seen, the index was basically “sideways” for all of August (the date of my last post) and went nowhere. We had some above average volume selling in June, in late July/early August, and again on August 9. We have not seen any huge buying volume going on. Indeed the market has gone higher, but I wonder if this is akin to a motor-less boat on a lake: merely by a stroke of luck it is drifting in a certain direction. Which prompts me to look at other “investment vehicles” – if money is not flowing into stocks, where is it going ? Lets take a look at Gold, the “safe haven” investment in times of chaos and turmoil.
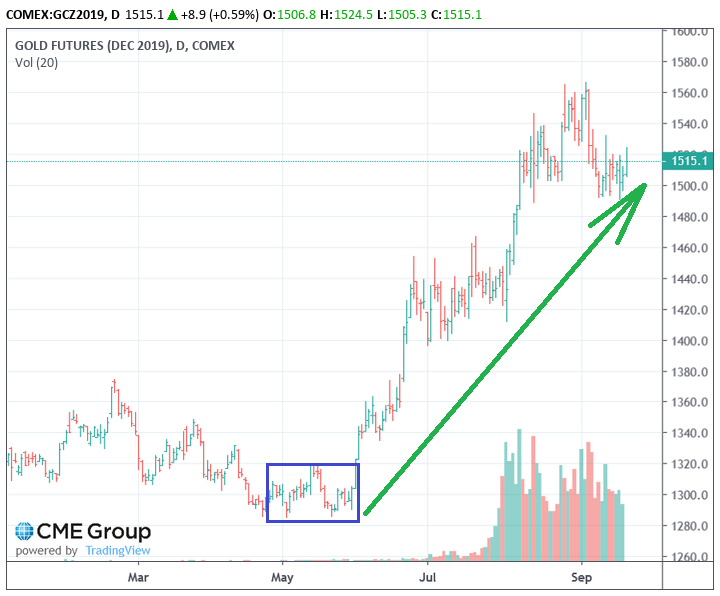
Evident in the graphic above, is that Gold is near all time highs of $1500 per ounce. Prices were “sideways” until June 2019, then various catalysts propelled Gold higher. What happened in June ? Some things were: Iran downed a US drone, the G-20 summit occurred with no US/China trade progress, and we sanctioned Iran. So for whatever reason, institutional money aka “smart money” decided to move into Gold, resulting in the price being driven higher. So if “smart money” is nervous about the investment climate, I wonder if I should be ?
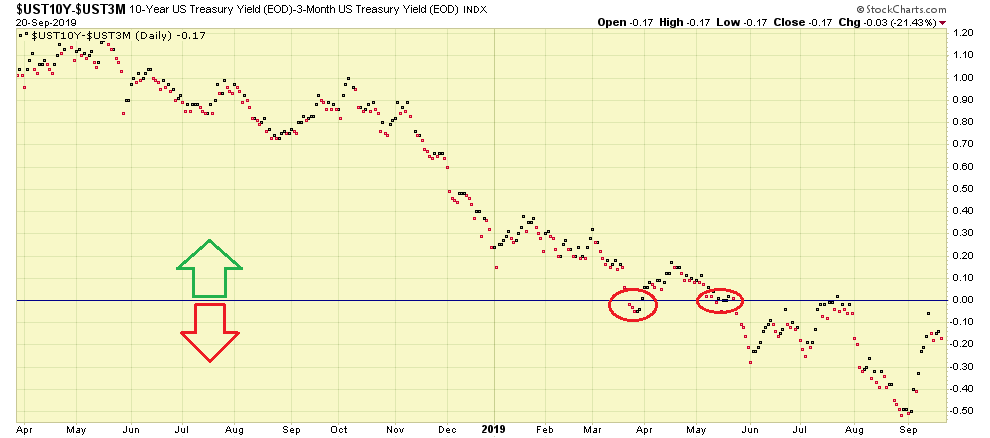
Moving forward, the Yield Curve remains inverted. Yet another term that I have talked about on this site ad-nauseam, the bottom line being that the Yield Curve is a proven indicator of a recessionary climate. Lets take a look:
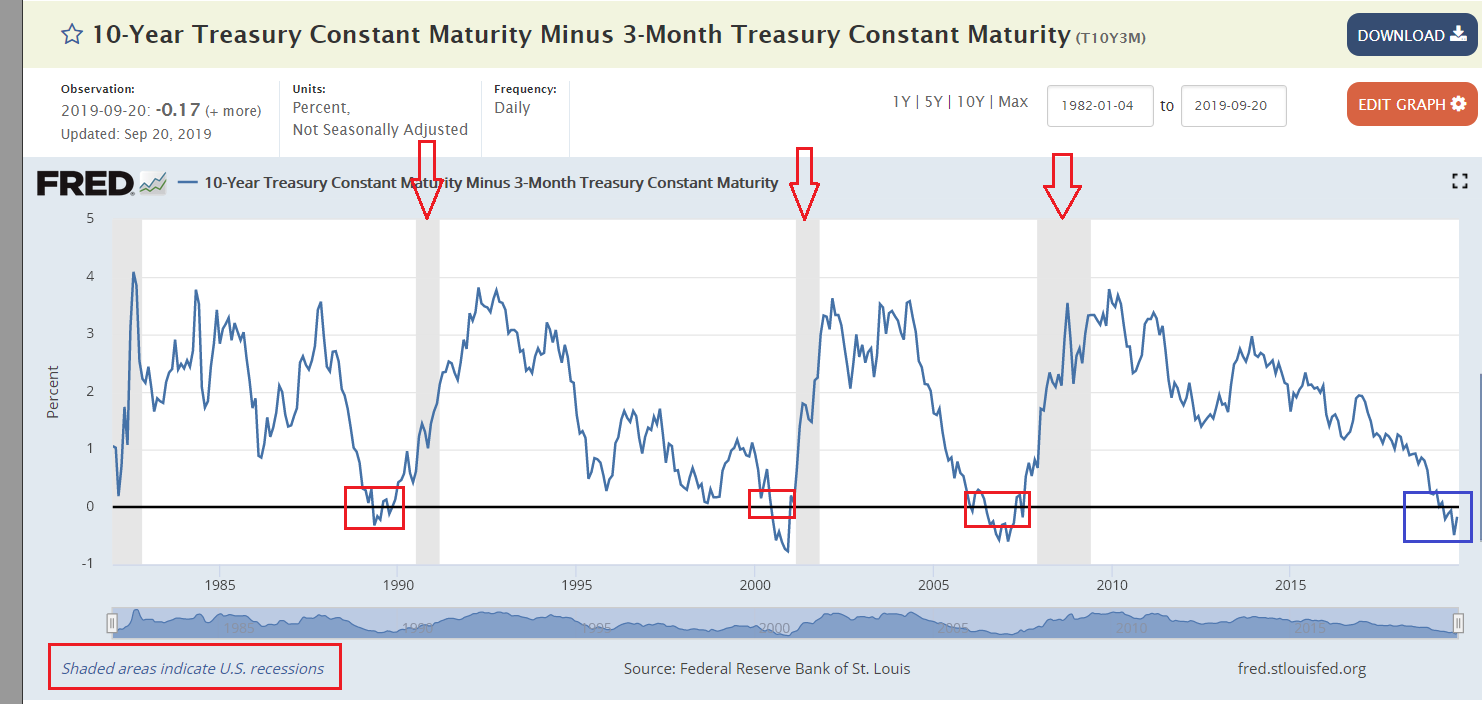
Seen above is the behavior of the Yield Curve prior to every recession since 1990, or over the last 30 years. You can see the Yield Curve “go negative” (below zero), then recover, then a recession is declared months later. Important to note is that stock markets will collapse prior to the official declaration of any recession. Many “experts” in the financial media will be quick to naysay the Yield Curve, claiming “sure, but a recession may not be immediate.” Sure, maybe not. But stock market sell-offs and crashes occur before recessions occur. This is known as a leading indicator. The body tasked with “declaring” recessions is the National Bureau of Economic Research, via the Business Cycle Dating Committee (BCDC); any such declaration will be made long after it starts:
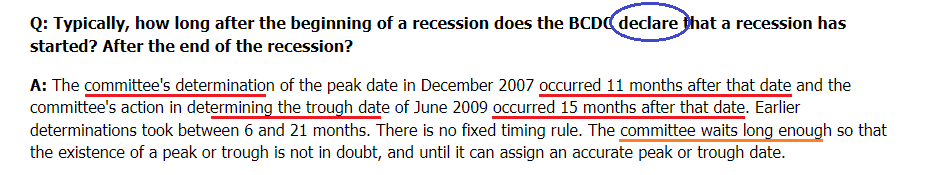
In my opinion, if anybody wants to wait until someone “declares” a recession, prior to modifying their investment allocations, they will be very late to the party. Is the Yield Curve “early” (by months…) at indicating a recession ? It sure is. And that is what we want.
I would be remiss to post an update without talking about the recent interest rate cuts. In July and September, the Federal Reserve cut interest rates, known as “insurance cuts” (a term used by FOMC officials themselves) as a protective measures against economic threats. The stock market’s response was largely muted, again, by looking at the chart of the S&P 500, no huge volume came into the markets.
Inflation data seems to indicate that inflation is on the uptick, which in layman’s terms, means that your paycheck (or fixed income retirement check) is not getting bigger but the cost of products is more expensive. And here is where we circle back to tariffs. If products become more expensive, and your income remains the same, you start feeling pain in the pocketbook, which triggers reduced spending. One measure of inflation is “Core CPI”, lets take a look at the most recent chart:
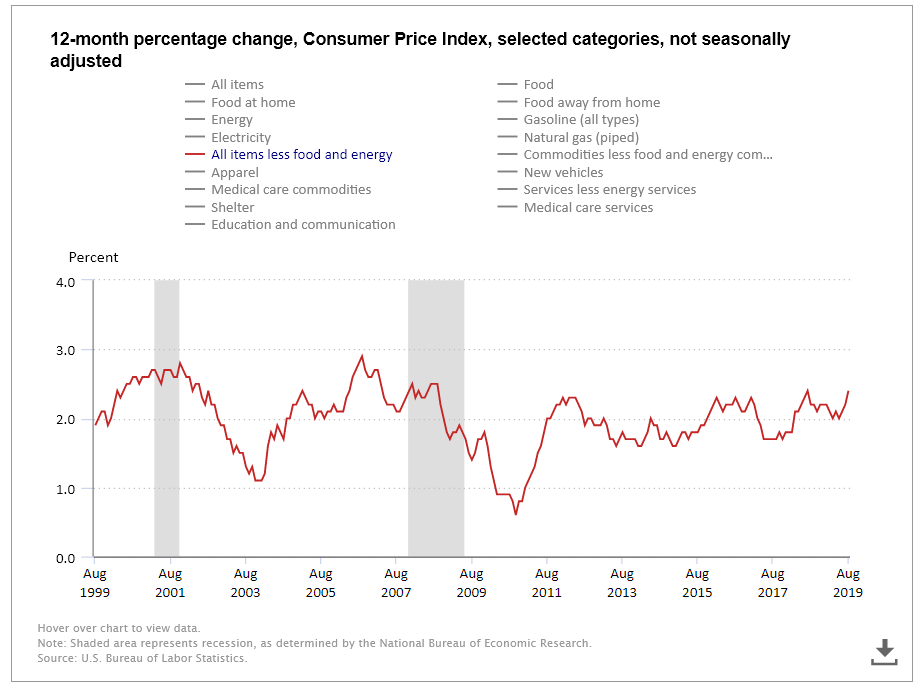
Data for August 2019 reflect a Core CPI measure of 2.4%, the highest amount since July 2018. The highest amount prior to that was 2.5% in September of 2008. In summary, any exceedance above 2.4% in Core CPI will be a ten year high for inflation.
In regards to US/China trade talks, as we approach late September, no progress has been made. Last week, China officials were in the United States at our request (they did not decide to come visit themselves….), with planned tours to US farms as part of their visit. These were cancelled at the last minute for unknown reasons.
Until we see a “signed trade deal” (with terms favorable to the US), and in light of the above indicators (none of which are perfect, error-free crystal balls…), I opt to remain 100% G-Fund in my personal TSP account, both current allocation and ongoing contributions.
Thank you for reading. If you find this website helpful or informative, please share it with your friends and colleagues.
Thank you
-Bill Pritchard
