
Hello to all the subscribers and Happy (belated) New Year. I waited until now for this post, desiring to let the first two weeks of January come and go, with some market messaging hopefully obtained by now. Let’s talk about the continued lethargy on the indexes and the challenges which appear to exist in the near term.
Shortly after my previous post (on December 20), the markets indeed rallied, but this was on very low volume. I have stated numerous times on this site that volume is the “horsepower” behind the corresponding move, a move up with strong volume reflects a high probability that the move will continue. A move up on low volume, not so much. See chart of the S&P 500 index:
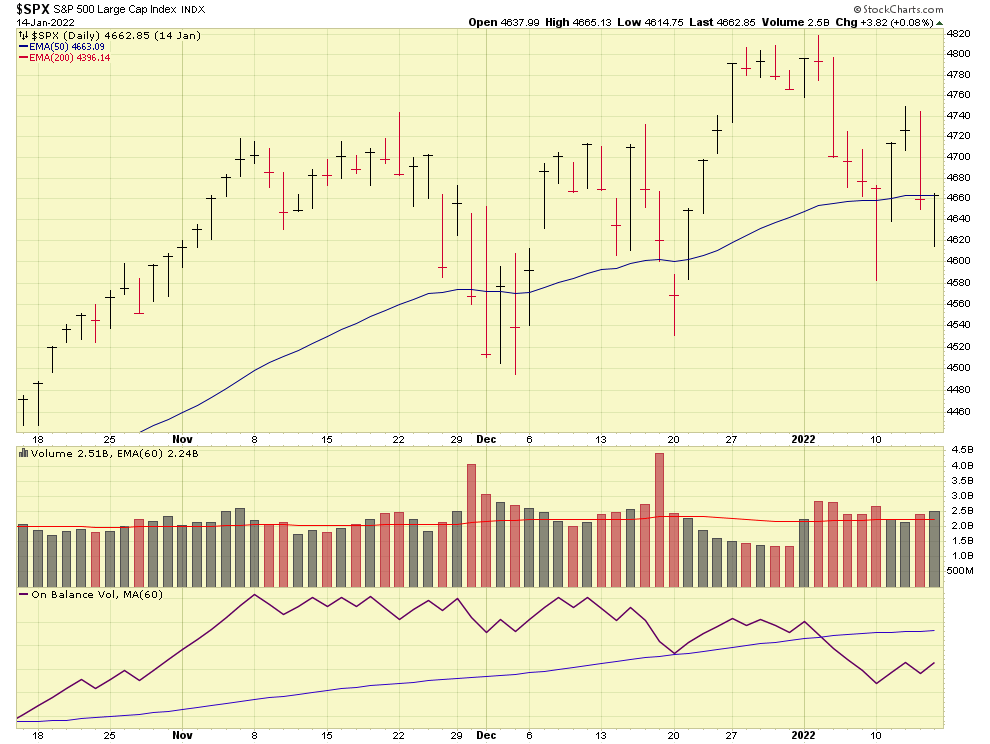
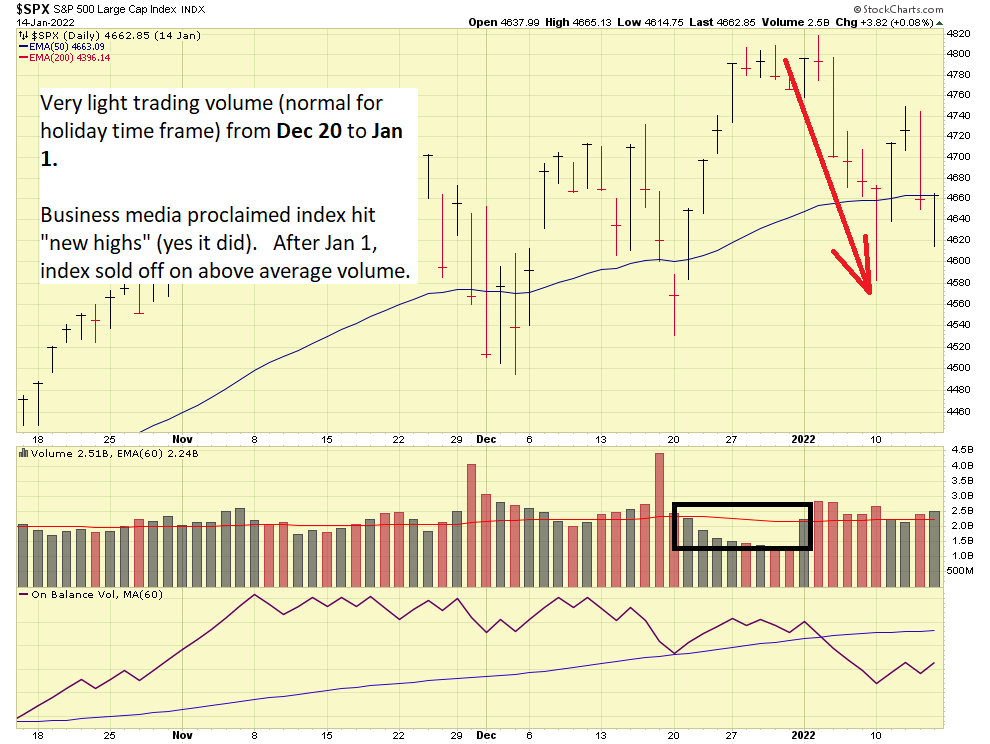
As we can see, the low volume coincides with the Christmas and New Year holiday time frame. Once “Wall Street came back” from the holidays, the first week of January, the index went lower each day of the first trading week of the year, on above average volume. It then recovered slightly, likely due to bargain hunters “buying low” but then deteriorated a few days again. As of Jan 14, the index is basically in the same position as it was in November and December.
The tech heavy NASDAQ, also the location of many S-Fund / small cap companies, is performing even worse, having broken thru its 50-day and 200-day Moving Averages:
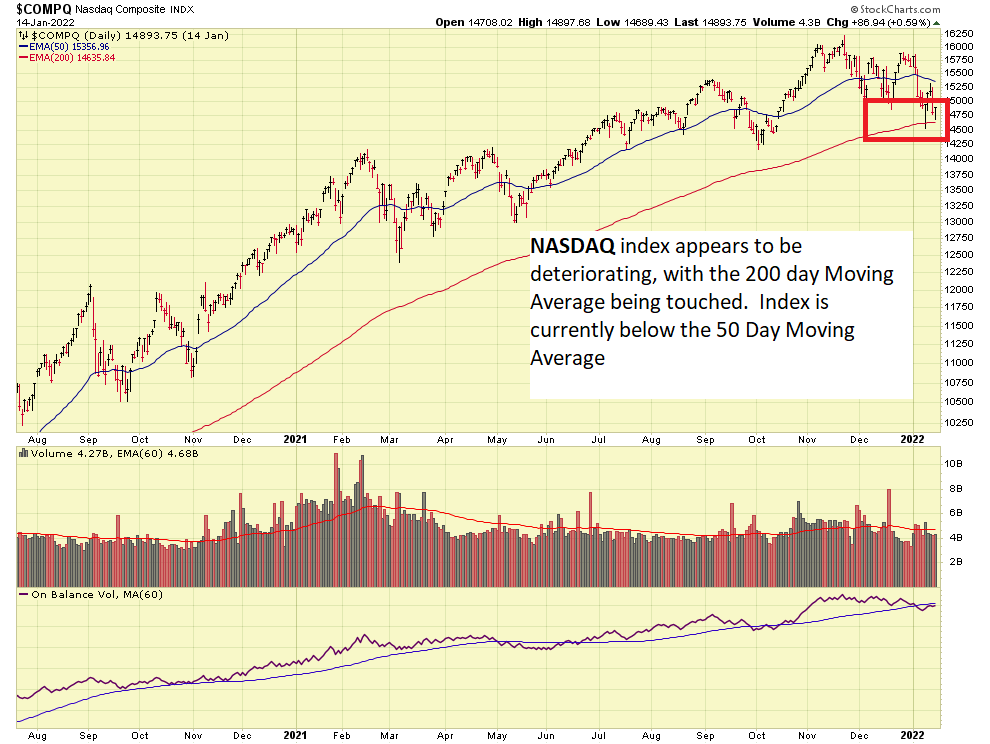
While the above performance does not mean it is time to panic, it is clearly undesirable and especially so, in light of the fact that trading during the first week of the calendar year historically “sets the tone” for the rest of the year.
What is causing this to happen? As stated in my December 20 post, the concerns appear to be inflation, and COVID (Omicron variant). Please do not interpret my musings about the markets as a political position, I seek to provide my opinion of why the market’s are not performing well, and nothing more. With that said, inflation data, per two key indicators, known as the Consumer Price Index (CPI) and the Personal Consumption Expenditure (PCE), is at historical all time highs. I spoke about inflation and interest rate hikes in 2015, at this March 11, 2015 post: http://www.thefedtrader.com/march-11-update-all-about-rate-hikes/
I will not regurgitate what I said in that post, so lets post some visual depictions of just how high inflation has gone up:
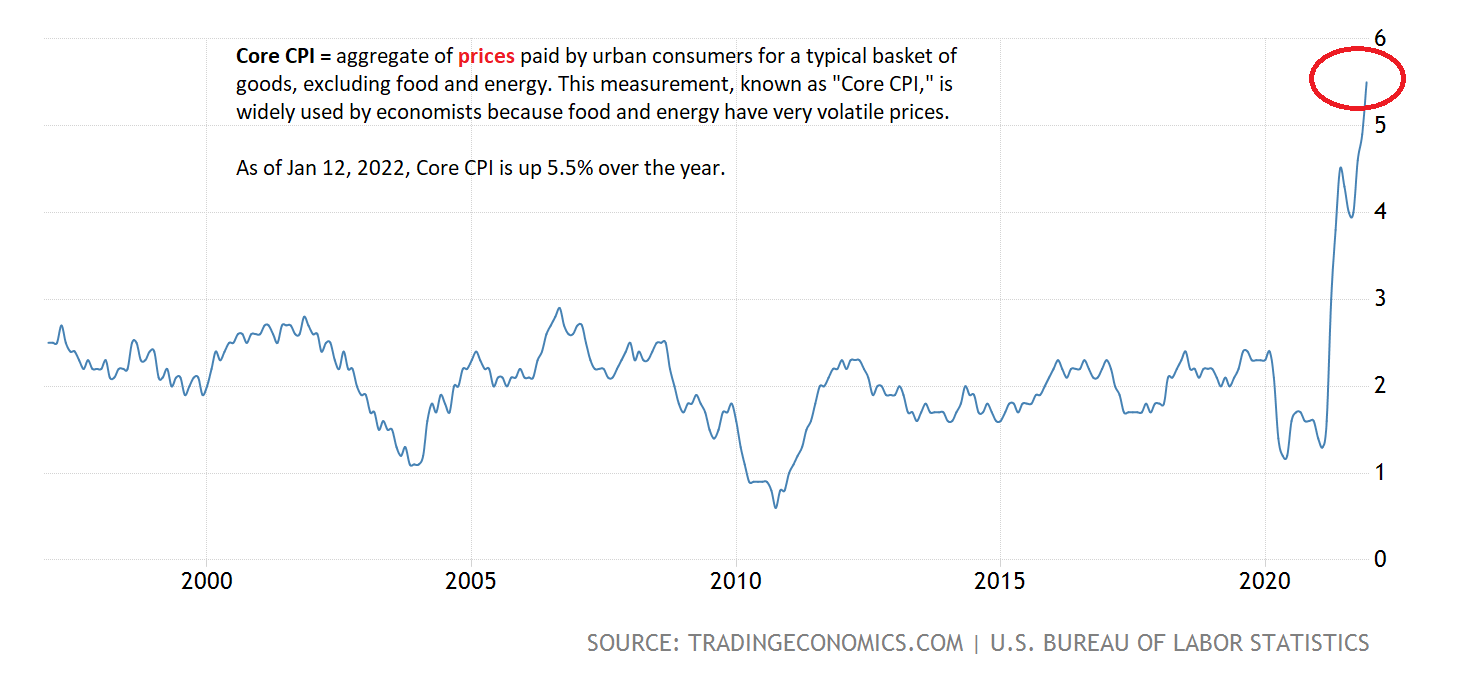
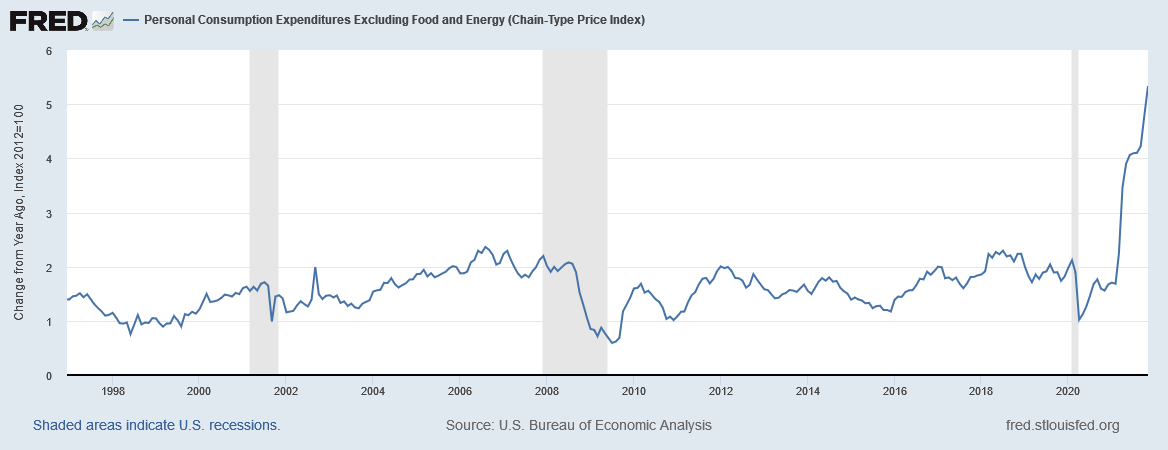
CPI and PCE are basically measuring the same thing, albeit with a slightly different formula. The “Core” data is the measurement not including food and energy (gasoline, etc.), since food and energy can be very volatile and very supply chain dependent. Core data above reflects rising inflation, at levels never seen before. This inflation began to rise, per the charts, both in early 2021. The markets digested it fairly well, in 2021, because no other headwinds really existed.
Flash forward to late 2021, and we have two things: 1) Inflation has no longer “begun to rise” like it was labeled in early 2021, it clearly is at excessive levels, and 2) COVID via the omicron variant is a new threat to the economy. We have talked about inflation, lets move to COVID, with charts of CDC reported deaths, and of COVID related ICU admissions.
In my opinion, “new cases” is a worthless (or almost worthless) data point, as some people get COVID and recover quickly, others may test positive but they never had any symptoms, and other reasons. A direct link to “new cases” and “negative impact to the economy” would be a big leap. However, again, and let me emphasize this is my opinion, the best way to assess COVID’s impact is COVID death counts, and COVID ICU admissions. Is it a perfect way? Is it flawless? No. But I think it is the best way (or least worse of all the ways).
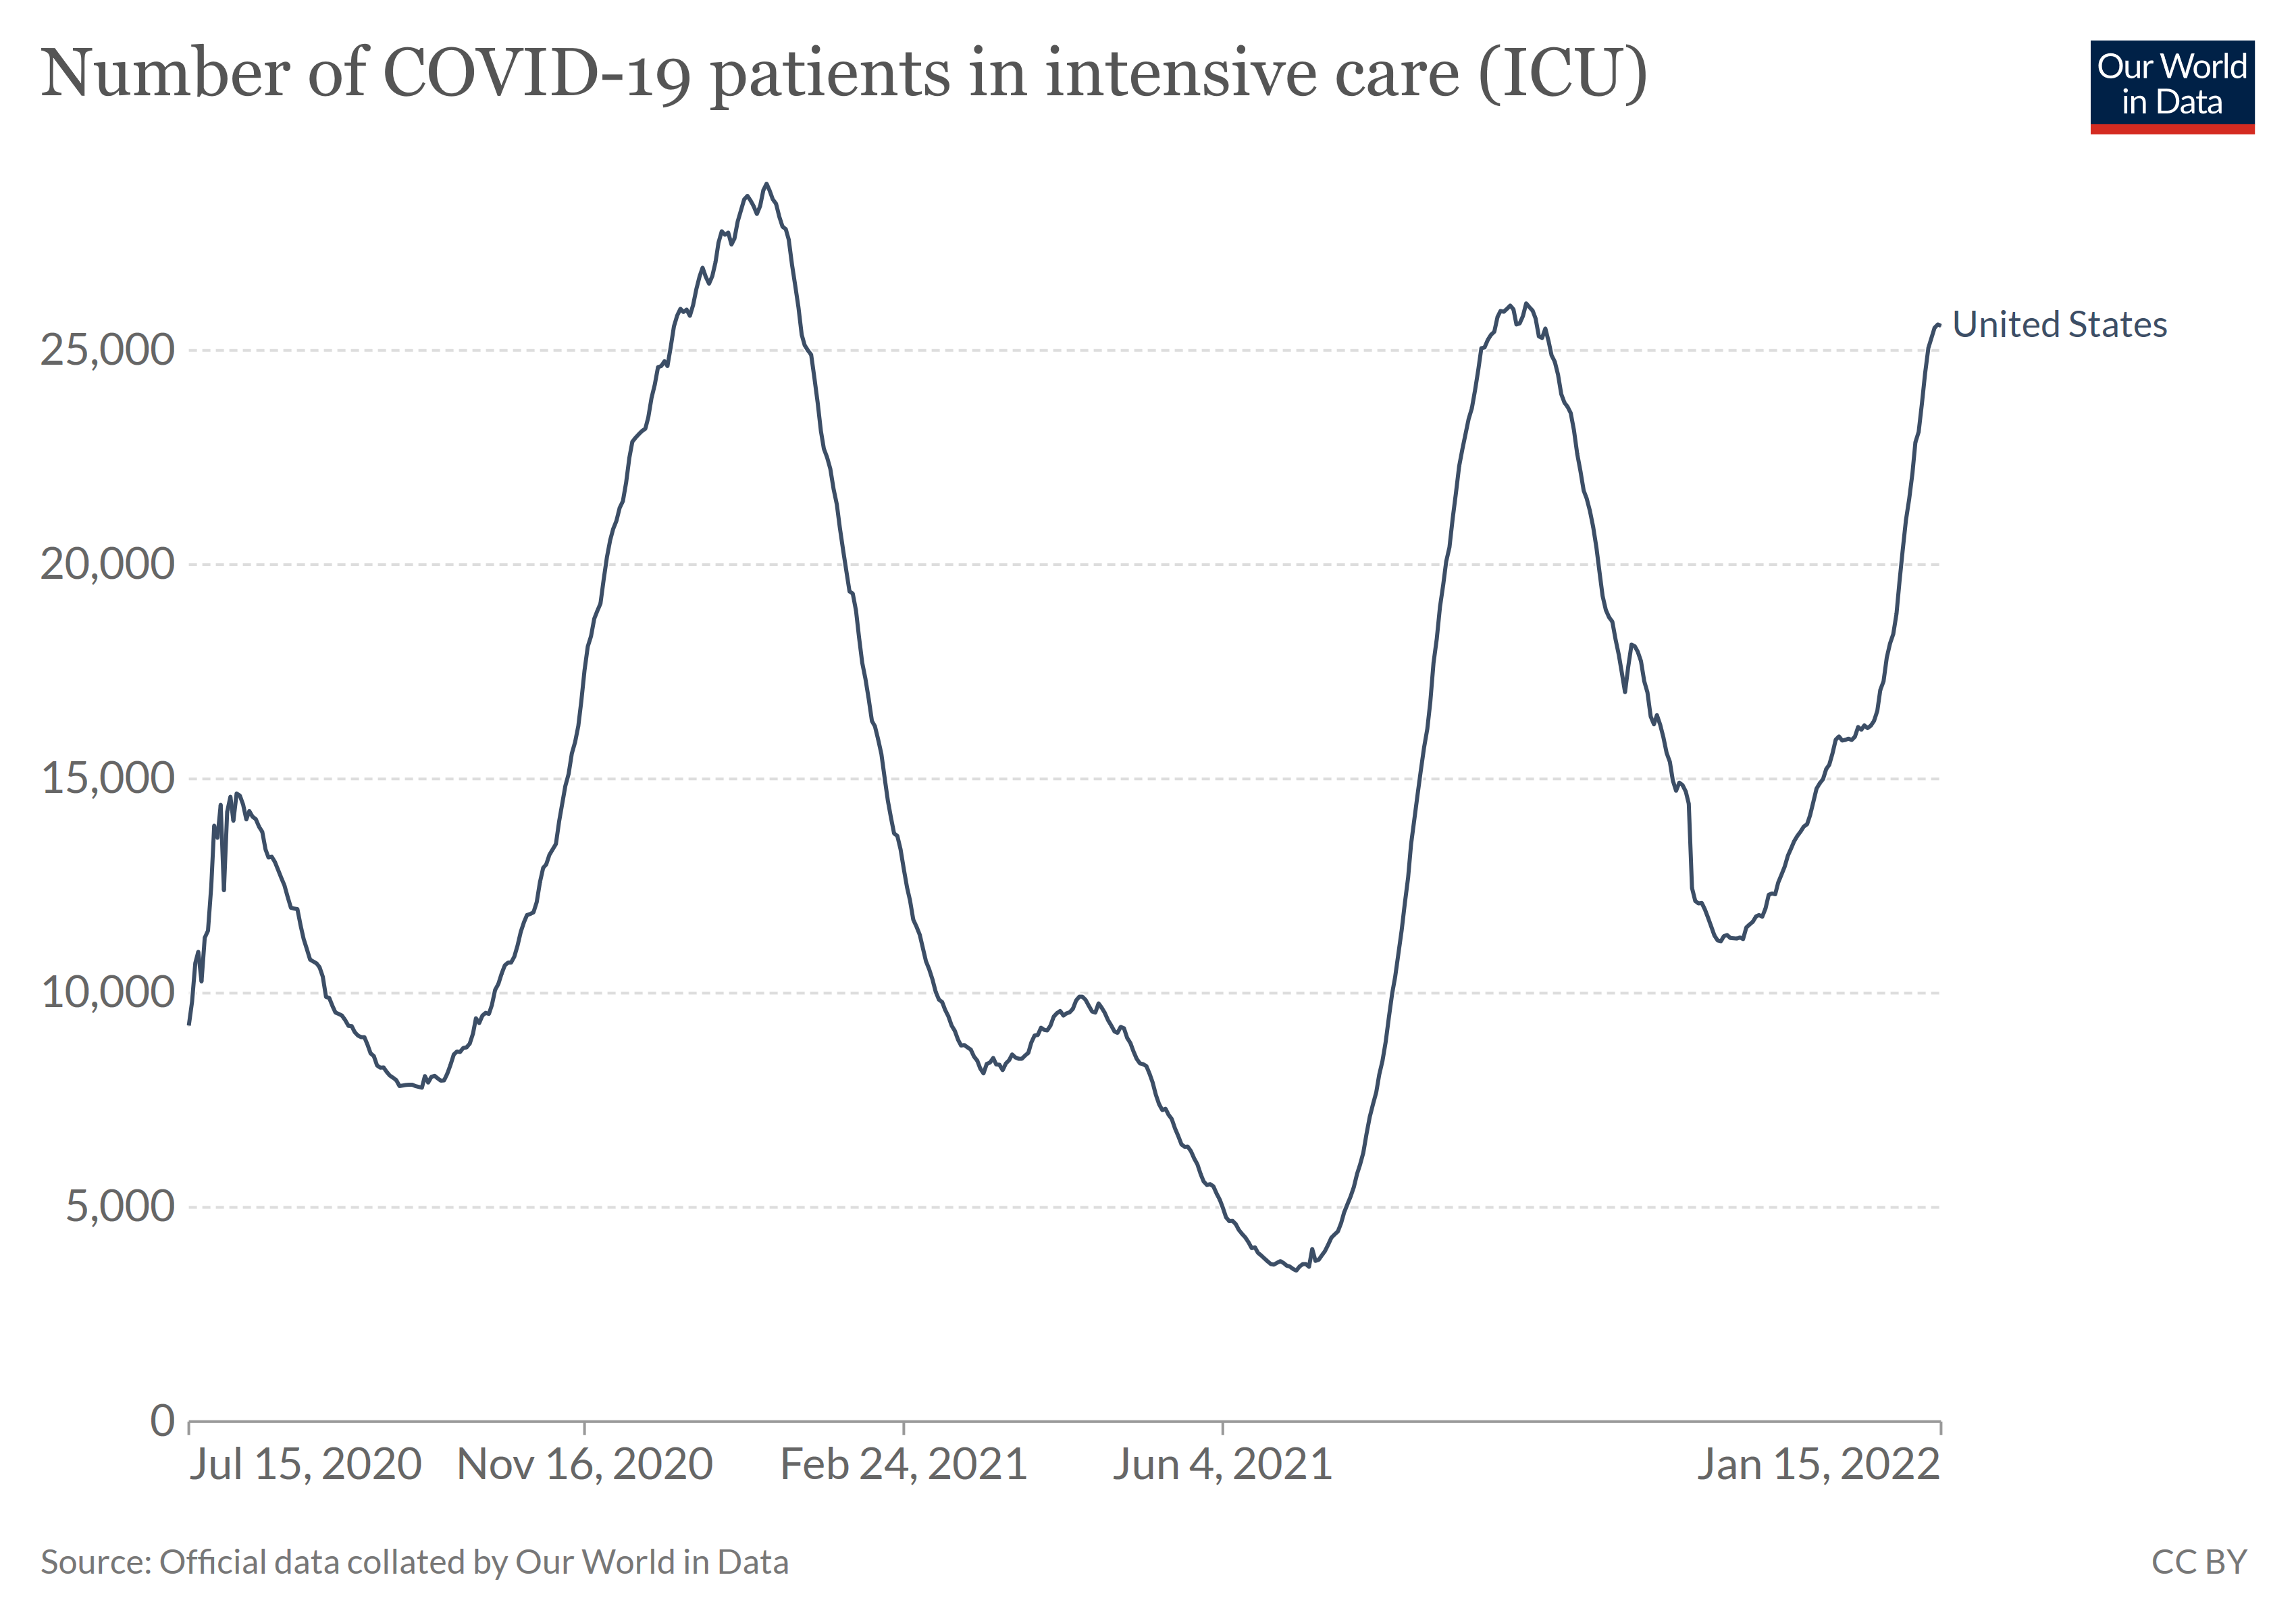
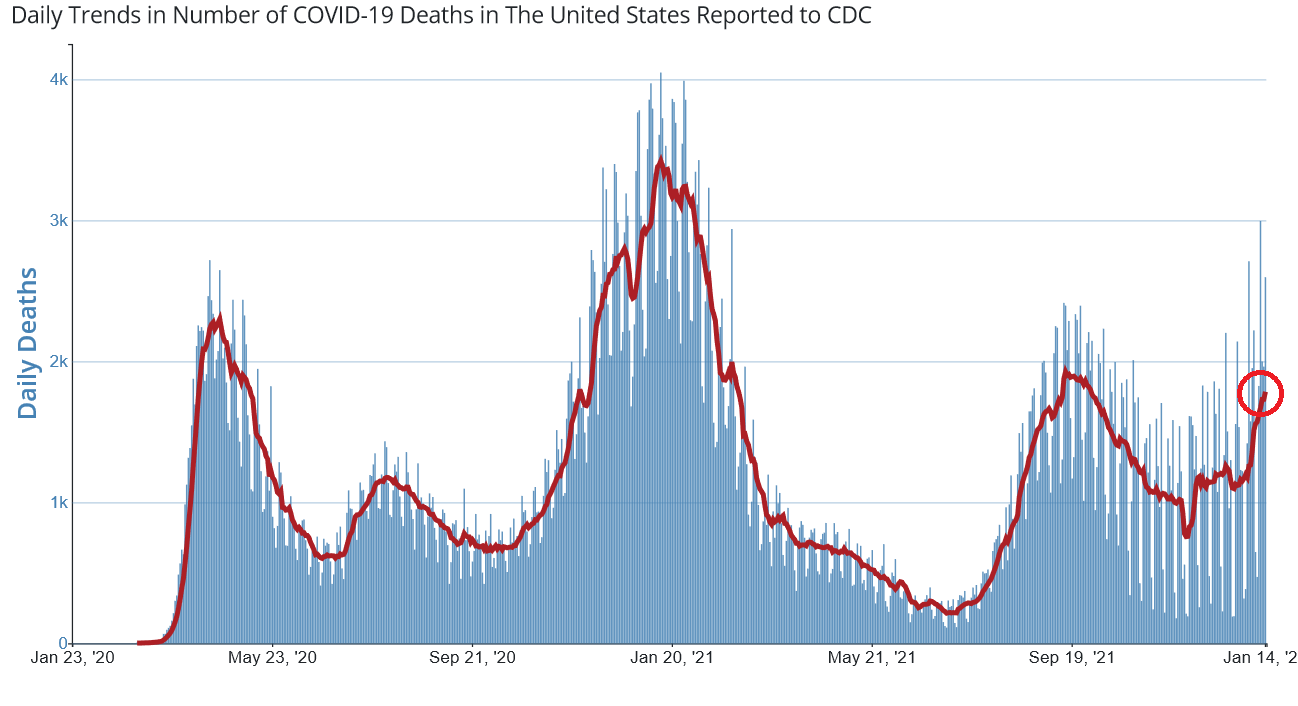
Unfortunately, if you are to believe the charts, both ICU admissions and death counts are headed up, not down. As big employers face OSHA mandates and compliance with “best practices”, the return to the office for corporate America is again in question, business travel, hotel occupancy rates face impact, and other things can be affected. Indeed, the Omicron variant appears to be “less severe” but staffing shortages are causing schools, airlines, and some restaurants to cancel operations.
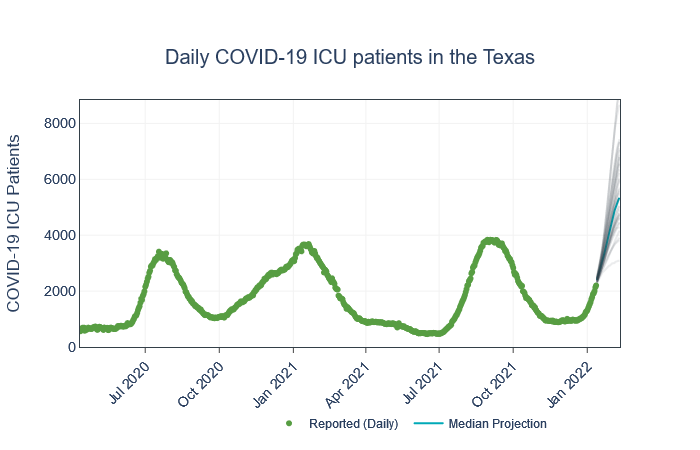
An ongoing research study by the University of Texas forecasts that in late January 2022, COVID patients in ICU’s will exceed all previous highs since 2020:
In sum, are major funds on Wall Street, with billions under management, and teams of mathematicians, analysts, and researchers on staff, not watching this? Of course they are. And it would be wise that the individual investor be aware of these challenges also.
With that said, a conservative-leaning approach to the TSP would be sound, in my opinion. I have stated that 75% G-Fund and 25% C-Fund is arguably the ideal allocation for most investors at the present time. I personally would probably not be 100% I-fund or 100% S-Fund or anything considered aggressive. At the risk of somebody claiming the Fed Trader is too conservative, I indeed embrace that stance, especially for the retirees. If you have been 100% S-Fund all 2021 and are thinking about reducing to a more conservative stance, then yes, now is probably the time to do it.
Standard disclaimer: How you manage your TSP is up to you.
With that said, my risk-adverse self is signing out for now. Let’s monitor the inflation, and COVID situation, and hope both stop their climbs.
Hope everyone has a great week, and talk to you soon.
-Bill Pritchard
