Monthly Archives: April 2014

April 27 2014 Update / TSP Allocation 100% G-Fund

Hello Everybody

Well, mom used to tell me that “if you have nothing nice to say, just don’t say anything at all” and her advice applies to the markets as well.   Sadly, I have no positive news, since my last post which occurred April 13, in which I advised that I was moving 100% to G-Fund.

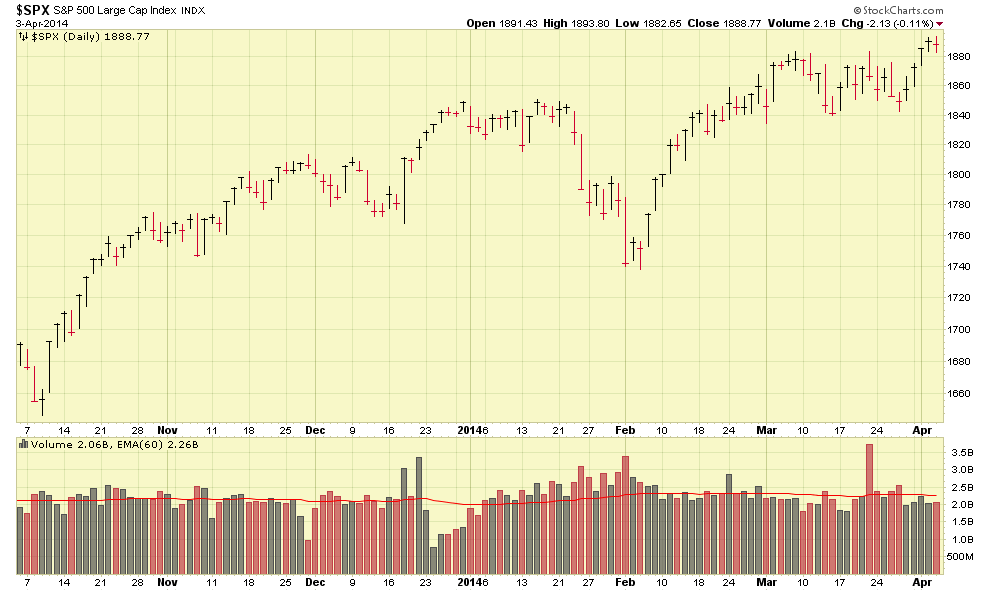
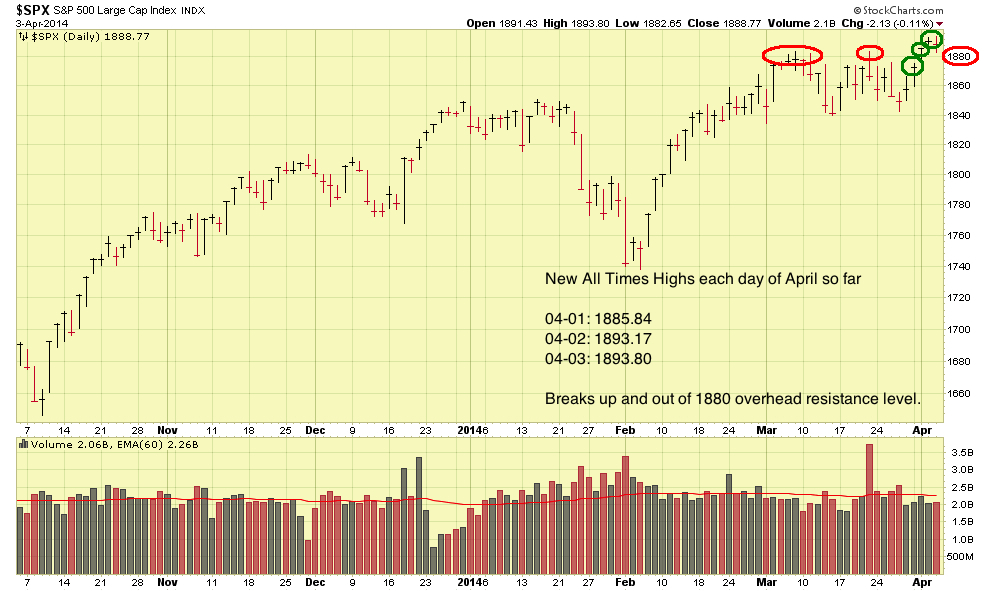
Since then, the markets have really done nothing.  Sure, they trended up, on average volume, and just as everyone was thinking about getting back into the action, on Friday April 25, the markets closed lower, with the Dow Jones Index down 140 points for the day.   Potential reasons (I hesitate to crystal-ball the markets) offered by mainstream media continue to be the Ukraine crisis, and some less than stellar earnings reports coming out of corporate America.  However, in the end, we have to follow the market itself, and with that said, here are some charts of the SP 500 Index, and SP 500 Futures (white chart), both without comments, then with comments:

SP500-Index-04-27-14

SP500-Index-04-27-14-COMMENTS

SP500-FUTURES-04-27-14

SP500-FUTURES-04-27-14-COMMENTS

Lets take a look at the action since my April 13 post.  From April 11 to April 15, the SP 500 Index (as discussed numerous times before, this is my “go to” barometer of market health) “found a bottom” (aka support) at basically the 1815 level.   It then proceeded to rebound upwards off 1815, however the volume was average volume on almost all days.   To really kick-start a new uptrend or break thru the frozen ice layer above us, I like to see above average volume, ideally 25% above the average volume, behind any new upticks in price.   This of course never happened and the index indeed went up, but on average volume.

April 22 to April 24, the index met overhead resistance at the 1885 area.   For the purposes of my ongoing analysis, I will continue to use 1880 the observed overhead resistance level, and 1840 as the support level.   Action between 1840 and 1880 appears to be akin to chasing a ping-pong ball around and attempting to predict where it will bounce.  So basically, I am only interested in action outside of those levels.   Let me clarify that, any action within those levels but occurring on above average volume, we need to pay attention to.   Note that 1815 is indeed a number to watch, as the market touched on it but bounced back up.   Any action below 1815 is clearly a negative. 

Some recent “high fliers” in the market have taken some blows lately, to include Facebook (FB), Amazon (AMZN), NetFlix (NFLX) and the Biotech sector.   Observe that these stocks are all NASDAQ stocks, and as such, the NASDAQ index will reflect a little more pain than the other indexes.   Time will tell regarding how these stocks perform.  Individual stock selection is not the focus of this site, there are hundreds of sites and information sources out there which offer such services.   Monitoring the markets and the TSP is hard enough.

The evening April 27,  SP 500 futures are trading rather flat, unable to trade higher than the prior session high, which would be April 25 session.   This may indicate that the Monday April 28 daytime action in the regular markets may be listless or a down day.

My TSP Allocation remains 100% G-Fund, as I prefer to “keep my powder dry” right now, and I see no signals or indications that moving to the stock funds would be a profitable thing to do right now.

Quick Re-Cap:  1840 to 1880 is to be disregarded UNLESS the movement is on above average volume.  Chasing the index in this area is like chasing a ping pong ball.  Ideally we get back above, and remain above, 1880.  Below 1840 is not desired.   Below 1815 is worrisome and troubling.

I don’t know if I am “buying” the media’s theory that the markets are down due to Ukraine.   Gold Prices (Gold is the “safe haven” investment) are lower, and Crude Oil prices are lower, than they were a few weeks ago.   Gold tends to rise, in times of political instability / war / etc, and Crude Oil, due to perceived supply disruptions due to war / combat actions, historically, will rise also.   See charts:

GOLD-FUTURES-COMMENTS

CRUDE-FUTURES-COMMENTS

Not that Russia v. Ukraine is Iraq v. Kuwait (from an oil supply perspective) but the point is this:   Crude and Gold are LOWER, not higher, than they were a few weeks ago, meanwhile the Ukraine/Russia situation has reportedly worsened.    What this means is that the markets may be going down for other reasons, which is more of a concern for me, than the theorized-temporary mood swing out of Ukraine nervousness. 

Lets keep our fingers crossed and see how this week turns out.   Thank you for reading and please share my (your) site with your colleagues.

Talk to everybody soon…

– Bill Pritchard

TSP Allocation 100% G-Fund

Hello everyone

I am changing my TSP to 100% G-Fund.   I wanted to be optimistic and look for some rays of sunshine behind last week’s market storm, however I (sadly) cannot find any.   The market is our ultimate indicator- theories, crystal-balls, opinions, or for that matter emotion, should not drive our investment decisions or strategy.    Allow me to post some charts and share my opinions behind my move to 100% G-Fund.

Lets take a look at the 18 month view of the SP 500, below, then a 6 month chart along with my comments below (and on the chart).

SP500-04-13-14

SP500-04-13-14-6-month-COMMENTS

As can be seen, we have been in a trading range since basically late March, on the SP 500, with 1840 being the bottom or support level, and 1880 area being the overhead resistance level or ceiling.  Any penetrations of these levels are important to look at.  We had some new highs established on the SP 500 early this month, however this was on below average volume.   I mentioned this activity in my April 3 posting.

With that said (and by now, most everyone has an understanding of why volume is so important…) , the new highs were on below average volume, and then things broke down and deteriorated.  The SP 500 then broke down thru its support level of 1840, on above average volume, something clearly not desirable.   I counted 8 days of selling in recent weeks, on above average volume, with 6 days of buying, on below average volume.

In addition, the SP 500 failed to find support at the 50-day Moving Average, an important short-term trend indicator, and activity below this level is not desired.   It is still however a healthy distance from the 200-day Moving Average indicator, which is a longer term indicator that major institutions sometimes make buying or selling decisions at.  Ideally, it stays away from the 200-day and finds support somewhere.

Sometimes the volumes on the index are hard to “decipher” so allow me to insert a chart of the ETF (Exchange Traded Fund) ticker symbol SPY, which “tracks” the SP 500 index and can be actually traded back and forth by investors.  It is one of the largest holdings in many big-name mutual funds.  I will not post comments, as nothing is changed from my discussion of the SP 500 Index.   However take a look at the volume behavior going back a couple weeks.

SPY-ETF-04-13-14-6month

Now, with my primary market indicator, the SP 500, having been addressed, lets take a look at the NASDAQ Index.  As I have mentioned before, the NASDAQ tends to be tech-heavy, and if Apple Computer reports losing market share to Android, this can drive the NASDAQ lower.   Does this mean the world is ending and the market is crashing ?  No.  However one must be cognizant that the NASDAQ is heavily weighted towards tech companies.   With that said, the S-Fund has a lot of NASDAQ exposure, as most smaller companies are listed on the NASDAQ versus the NYSE exchange.  Therefore, the NASDAQ cannot be ignored completely.   Lets take a look at the NASDAQ 18 month chart and a closer 6-month chart with my comments.

NASDAQ-04-13-14

NASDAQ-04-13-14-6-month-COMMENTS

As can be seen, the NASDAQ is below its 50-day Moving Average and close to its 200-day Moving Average, which is an important long term trend indicator and where many institutions and financial media tend to announce “bear market” territory for the respective index or stock.   This can be dangerous, as some market prophecies can then become self-fulfilling.   The market reaches bear market territory, and everyone then proclaims “yes, it’s a bear market” , and then everyone gets out of the market, thus pushing it down further.  Then soon after, people say “I told you so, it’s a bear market” and the fear and panic feeds on itself.   So the 200-day Moving Average bears monitoring.

The NASDAQ’s support level is basically “4000”, and on April 11, we saw a low of 3991.64 on the NASDAQ, penetrating this level to the downside, which is troubling.

For the reasons outlined above, I am moving to 100% G-Fund in my TSP.   I might add these turning points in the markets are also periods of “increased” reader email.   For every email I get saying “gee thanks, yes I feel better being out right now” I tend to get three that say “man, I sure don’t want to miss a good up day, I am going to wait a little longer” or “bro, we just missed a 200 point gain on the Dow, and we are in G-Fund, are you confident in your analysis” etc.   Or variations of those.    Sometimes people email me that “we are already down quite a bit, getting out now seems silly.  Lets just monitor things.”   Well, if you are #1 on the entry team, and Mr. Bad Guy puts one round (of many more soon to come) into your ballistic vest, are you staying in the same position ?  I mean, your vest already stopped one round, why not “stay in place and monitor things.”    I doubt anybody would really do that.

I appreciate the feedback, but remember it is not chasing gains that makes us money, it is minimizing losses.  Minimize losses and errors, and the scoreboard will take care of itself.  The TSP is not something to gamble with, it is the primary source of retirement income for FERS’s participants.  Hence I have no issue sliding over to G-Fund when I see trouble brewing.

Some theories and opinions abound as to why the market is going down, some say QE Program being cut back, some say Congressional Mid-Term elections, I have heard numerous theories/etc.   At the end of the day, evaporative water science, meteorology, rain fall statistics, etc., do not dictate whether I am using an umbrella.  I am using one if I start to feel raindrops physically hit my skin and I see rain clouds overhead.   The market itself, not theory, is the ultimate indicator.

umbrella.2

Again, I am 100% G-Fund.  Hopefully not for long…..

Take care folks

– Bill Pritchard

April 8 Update / SP 500 seeing downward movement

Hello Folks

As most are aware, Friday April 4, and Monday April 7, were challenging days in the markets.   The tech-heavy NASDAQ was hit hardest, due to weakness in Biotechnology and Internet related companies.   That is why I utilize the SP 500 to assess market health, it is a broader picture of the market, across numerous sectors.   However, to be clear, all indexes saw above average volume, and downward price action, which is something we do not want to see.   For a variety of reasons, outlined in this post, I am remaining 100% S-Fund (for now).

Observe that April got started on a great note, making new highs every day of the month, up until Friday April 4.   Also observe that Friday and Monday arguably carry some additional psychological weight to them, Friday is the “pre-weekend” day, as in, “lets sell our holdings, I want to sleep easy over the weekend” and Monday is the “pre-rest of the week day”, as in, “I am worried about the week, I am selling everything on Monday.”   If this does not make sense, let me explain it another way:  I would be more concerned if we had down days on above average volume had they occurred Tuesday, Weds, or Thursday.  We have heard “totality of the circumstances”….I apply it to trading also.  If a down day or days occur, I step back, and try to see a bigger picture before I panic.

Lets take a look at a chart of the SP 500, with daily volume and price action, along with my comments on the chart:

SP500-04-08-2014-week-comments

This “close up” view of the SP 500 clearly shows the downward price action on Friday and on Monday.  However, it also shows that the Tuesday April 8 action “found support” basically at the 50-day Moving Average, an important trend indicator.   Support found at this indicator is a positive sign, and reason to not completely panic yet.

Lets take a look at a longer term chart:

SP500-04-08-2014

SP500-04-08-2014-comments

Observe in the above chart that the 1840 area on the SP 500 is clearly an important support level, and bears watching, as does the 50-day moving average.  

After the daytime session closes on the markets at 4PM Eastern Time, I tend to seek out additional “intel” on how the next session will trade.  One great tool I use are the SP 500 futures, which trade almost 24 hours, electronically, and are frequently indicative of sentiment and how the stock markets will trade the next day.   Fortunately for the TSP participants, tonight’s SP 500 session is trading positively.   See chart:

SP500-futures-04-08-14-comments 

My explanations above reflect why I am remaining 100% S-Fund.   Allow me to be clear:  All the indexes (and funds) took a beating over that last few days.  I can’t sugar coat that or spin the news, it is what it is.  This site is about facts and analysis, and I am required to report accordingly.  The S-Fund got hit pretty hard, due to small-cap and NASDAQ exposure.   However, the overall trend is still intact (for now).   The market itself is our ultimate indicator, and I try not to crystal-ball or offer theories on why or what is happening.   If the market continues down, on high volume, then we need to evaluate a move to G-Fund.

However, I am not there, yet, and remain 100% in S-Fund.

Thank You for reading and talk to everyone soon…

– Bill Pritchard

April 3, 2014 Update – April off to a great Start

Hello Folks

Well the month of April is off to a great start, with the SP 500 index making new All Time Highs each day of the month so far.   This type of behavior is very desirable and a clear indication of bullishness and strength.   It appears the market has digested the Russia/Ukraine situation and is moving forward, past the prior worries associated to the emerging international markets.

Lets take a look at some charts, one without comments, one with comments, of the SP 500 Index:

SP-500-04-03-14

SP-500-04-03-14-comments

On a 30-day look-back period, the C-Fund has outperformed the other funds.   On a one (1) week look-back, the S-Fund has outperformed.   My current balance remains 100% S-Fund, however 50% S-Fund and 50% C-Fund would also likely be a productive allocation.

The only negative associated to the market’s performance so far is that it has occurred on less than average volume.   Numerous times I have discussed how volume is the “horsepower behind the move” and unfortunately the volumes have been light so far.   Lets see what happens as the month becomes more mature.

Speaking of volume, the subject of High Frequency Trading has been in the news lately, with author Michael Lewis speaking of “rigged markets” and unfair advantages by professional traders.   Lets take a look at a video by CNBC:

http://video.cnbc.com/gallery/?video=3000263240

The premise of this theory is that professional traders may be able to enter trades at better prices than the other guy, due to high speed trading systems and communications lines.   I suppose a 5 cent advantage per share is clearly an advantage if you are trading $1B dollars.   Why is this discussion important for the TSP investor ?  Because my system (of which literally thousands of The Fed Trader subscribers read about, yes I can say that, thousands….) is more of a long-term trend following and momentum based strategy.  I am not looking to gain a two-cent edge on the intraday price of Google shares.   I am looking at long-term, behavioral, trends.  Patterns of behavior.   And while High Frequency Trading and all the (alleged) magic black boxes and secret programs may indeed give professionals some advantages, at the end of the day, you can’t hide the volume of shares traded.   And volume tells us what is going on behind the scenes.

As an example, lets take a look at TSLA (Tesla) chart.   This is a stock I traded personally, and was able to obtain some profits from.   Keep in mind my often discussed theories of overhead resistance (in TSLA example it was $40 area) and “breakouts” and All Time Highs on above average volume.   Was High Frequency Trading in play here ?   I am sure it was.   Did it matter for me ?  No.    Charts with no comments, then with comments.

TSLA

TSLA-comments

Remember, we are looking for changes in sentiment, changes in behavior, changes in mood, when assessing the markets and individual stocks.   If anyone saw the March 2014 print version of Money Magazine, a notoriously conservative (but high quality) magazine (any cover story will advocate bond investing), an article appeared which semi-endorsed momentum investing.   Indeed, many find it difficult to buy All Time Highs, and instead buy on the way down, instead of on the way up.    I caution against trying to catch falling knifes, and advocate buying strength, versus weakness.

This is directly applicable to TSP investing, as many in TSP land feel that every time the markets make a new high, that doomsday is around the corner and a market crash is pending.    In my opinion, that way of thinking will negatively impact your rates of return.

I am presently 100% S-Fund for the time being.   I ask that if you find my site and emails/updates informative, please pass them to others who may benefit.   I had a reader communicate to me that this (completely free) site was “worth its weight in gold” as his TSP was up over $50,000 in the last 12 months, an amount not likely possible had this reader not become educated regarding the markets and TSP….this person had initially planned to be in the G and F-funds.   Do you know anyone who seeks to become more educated and informed regarding the markets and its correlation to the TSP ?   Please pass the word.

Thank you and talk to you soon…..

– Bill Pritchard