
The markets continue to have “summer lethargy”, with weak volumes and volatile action. The week of July 9 witnessed extreme swings on the Dow Jones Index, with 200 points down one day, and 20o points up the next. Allow me to discuss some of the recent action, and share a look into my crystal ball in regards to the future. Dare I say it, but our bull market may be out of steam when 2020 arrives (or sooner). More on that in a minute. First, lets look at the most updated TSP Fund returns:
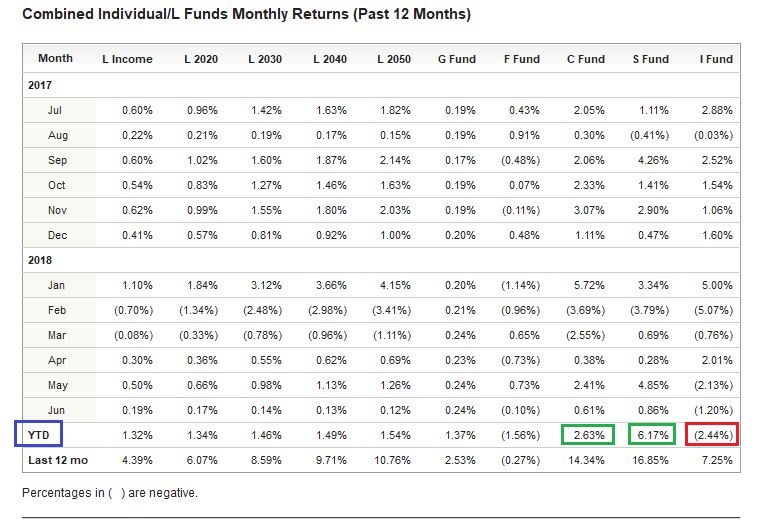
Both June 2018 returns, and Year-to-Date (YTD) returns reflect that the S-Fund performing best, with the C-Fund as the next best performer. I-Fund yet again is negative in both prior month, and YTD categories, and happens to be negative for the last four out of six months. Readers will recall my numerous prior posts regarding my personal opinion that I-Fund is not the place to be right now- sadly during the year numerous “other” TSP sites and discussion groups all advocated investment in the I-Fund. My personal TSP still currently reflects 50% C-Fund and 50% S-Fund, since December 2017.
Some have asked why S-Fund is performing better than the C-Fund, the simple answer is “domestic large caps” in almost all cases have an international nexus to their business model, despite the fact that they are US companies. Exxon, Boeing, General Motors, Pepsi, all have customers overseas, and depend on global trade to have success, and subsequently will be impacted by threats of trade wars and tariffs, much more so than small cap stocks. However I still believe they are an important part of my portfolio, and remain 50% C-Fund.
Another observation is that the G-Fund (subject to naysayers and critics…) actually outperformed the L-Income, and L-2020 funds on a YTD basis. To repeat, “Old G” just beat two other funds. This is an ideal time to refresh our awareness of the G-Fund. In earlier days of this website, many would question my statement that G-Fund was ideal for protection and “safety”, and would criticize my use of G-Fund as a “tool” on the path to TSP success. I typically would identify those close to retirement, the risk intolerant, and the less adventurous, as being some, or all, of the people who may prefer to utilize the G-Fund as part of their portfolio. The noise was subdued when I reminded folks that this strategy was not some earth shattering epiphany that I created, it was actually from the TSP website itself. See image below, and link: https://www.tsp.gov/InvestmentFunds/FundOptions/fundPerformance_G.html
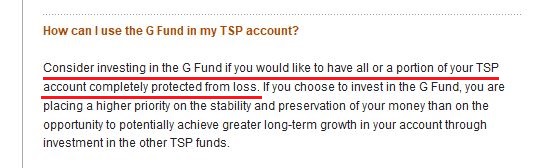
Note that the TSP themselves considers the use of the G-Fund to be “investing”: To be clear, nobody is “cashing out” their TSP or putting the money under their mattress when they move out of stock funds and into the G-Fund, they continue to invest, albeit in an extremely conservative way (and an equally extreme low rate of return…). Let me conclude this refresher with stating that I personally do not see the G-Fund in my TSP allocation in the near future, due to my opinion that the stock markets will likely continue upward in the coming months.
Lets move ahead now and take a look at recent market action. Both the SP-500 and NASDAQ have attained “All-Time-Highs”, albeit on less than average volume. See charts:
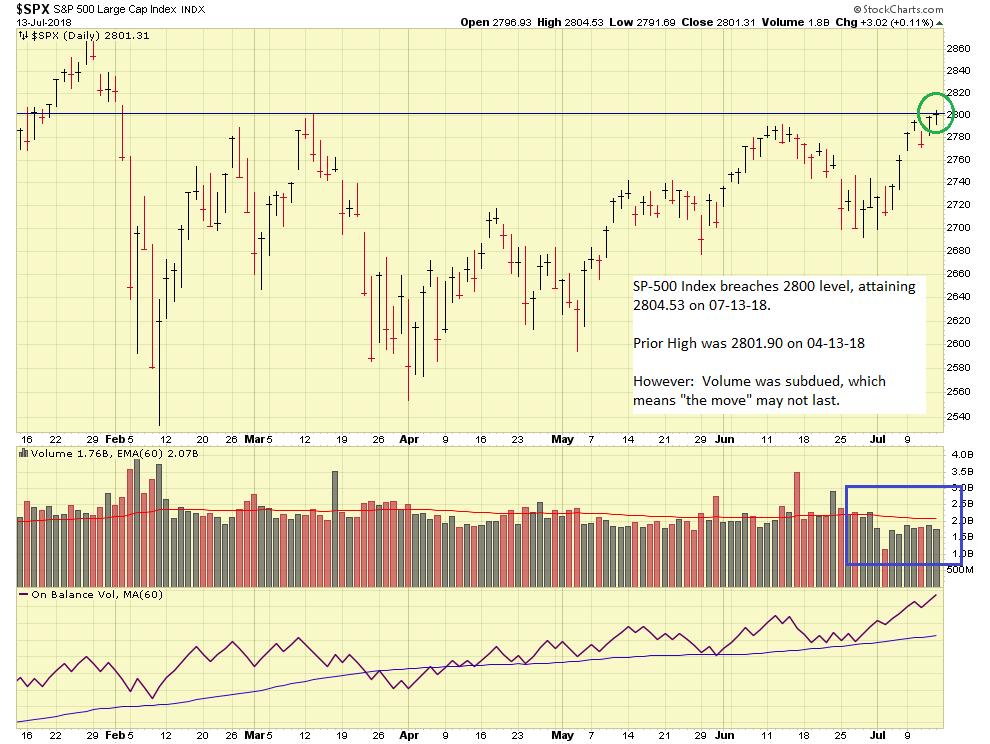
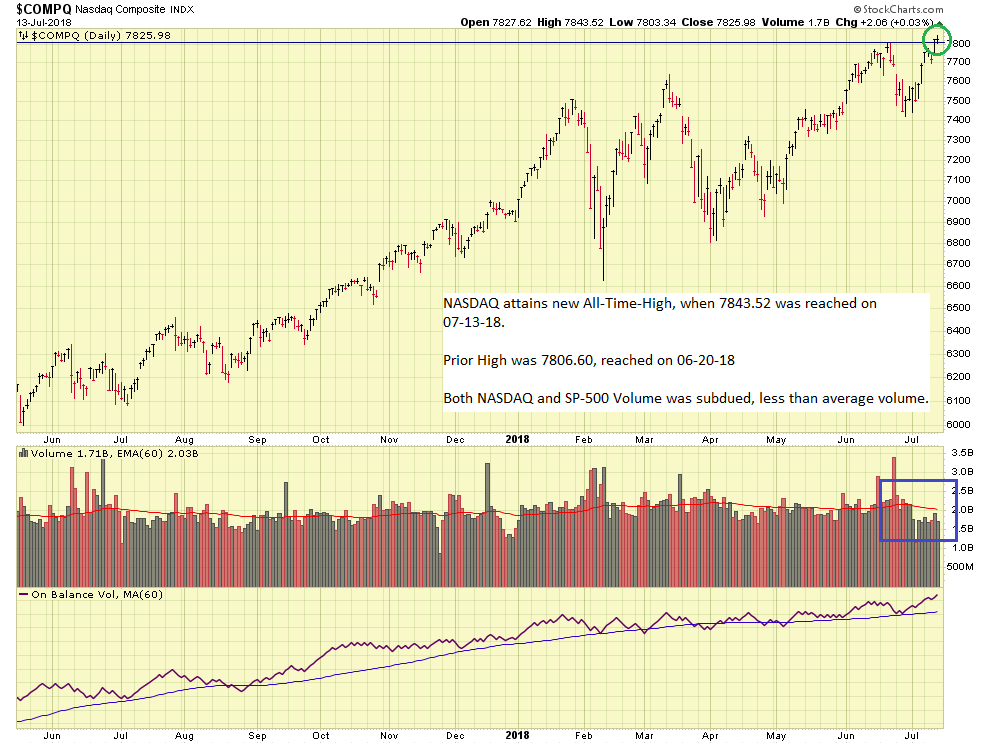
The SP-500 broke thru resistance at the 2800 level, the next level to break is 2875. We do not want the SP-500 to return below 2800, this behavior would reflect weakness and provide reason to doubt the market’s ability to climb higher. The NASDAQ attained an 20+ year All-Time-High on July 13, breaching the 7800 level. Similar to the SP-500, we do not want it to drop back down and display weakness. There is no overhead resistance level (no “cloud deck” overhead) since it is now at uncharted, fresh highs. The awesome folks at Investor’s Business Daily report that NASDAQ Accumulation has reached a B-, an improvement from a C (neutral) , reflecting that institutional investors are beginning to take positions again in NASDAQ stocks.
So let’s get to my earlier statement, regarding the bull market and possibly weakness ahead. Note that catalysts propel (and, repel) the market action. New politicians, new economic policy, war, innovative inventions, etc have all been important catalysts over market history. However some economic data has started to trickle in which may negatively impact the bull market. Inflation data, as measured by the Consumer Price Index (CPI), minus Food and Energy, reflects that inflation has risen to all time highs, at a 2.3% 12-month change rate. See chart:
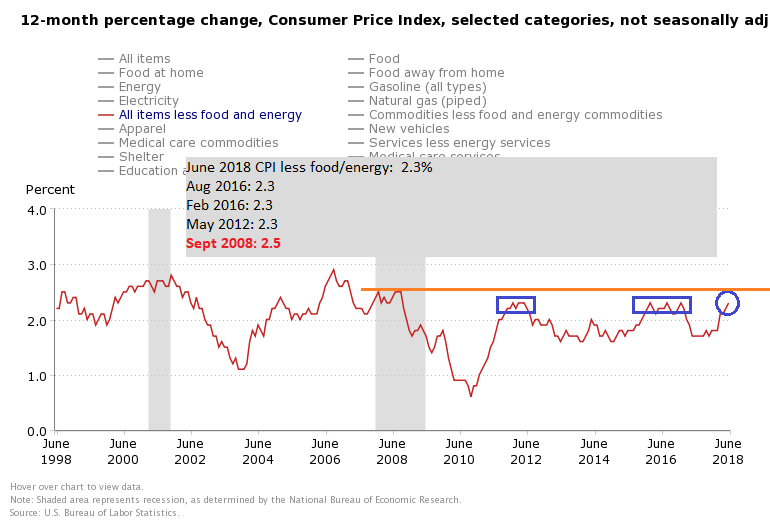
Note that the 2.3% level was touched in 2016, then not again until back to 2012. The prior high was 2.5% in September 2008. If CPI rises to 2.4% or higher, the markets (right or wrong…) will likely find displeasure with this, and sell off. If it breaches 2.5%, I can almost guarantee it will be on the cover of the Wall Street Journal and a major news headline. Continued, consistent, repeat high CPI numbers will likely amputate one of the legs of the bull market. Note that the FOMC uses the PCE Index, and not CPI, as its primary inflation measure.
Another item worthy of vigilance is the Yield Curve.
The Yield Curve, as discussed at Investopedia, is a line that plots the interest rates, at a set point in time, of bonds having equal credit quality but differing maturity dates. The most frequently reported yield curve compares the three-month, two-year, five-year and 30-year U.S. Treasury debt. This yield curve is used as a benchmark for other debt in the market, such as mortgage rates or bank lending rates, and it is also used to predict changes in economic output and growth.
When displayed graphically, a flat or inverted yield curve is a negative signal for the economy. We are not flat yet, however fairly close, and similar to the CPI, continued, consistent, repeat days of a flat yield curve may amputate another leg of the bull market.
I would take about rising interest rates however when rates were zero (0%), the FOMC’s gradual increases from zero do not seem to be negatively impacting the markets yet. Yet. With two more expected this year, and three likely in 2019, and possibly three more in 2020, the market may be in a different mood in the future.
Another tool in my toolbox is housing data. A weakness in the housing sector tends to be a reliable harbinger of a weakening economy. We “are not there yet” but one can surmise if mortgage rates continue to go up, home purchasing may be impacted. Again, “we are not there yet” but it is something to be cognizant of.
Finally, and most important, is the market itself. Widely known is the fact that the current bull market was born in 2009, at 9 years old, its service life is in uncharted territory. Add to the environment a heated political climate, Presidential elections in 2020, fears over global trade wars (justified, or not…), and possible future structural issues with the financial system (interest rates, inflation, etc), and Mr. Market indeed has quite an obstacle course ahead. I remain in stocks, and see no immediate danger ahead, however for the above reasons my opinion is we may see the Bull market cool off in the next 12-18 months. Markets lead recessions, they go down before recessions, and before negative unemployment data, is observed. To be fair, unemployment numbers are an important data point for the economy, however they do not predict stock market crashes. GDP data, price to earnings ratios, the value of the US Dollar, all are about as accurate at predicting stock market crashes as is staring at a thermometer for predicting high winds.
I hope you have enjoyed this update, please continue to share this site with your friends and colleagues. Thank you for reading and barring any critical or urgent news, I will talk to you again in a few weeks. My current TSP Allocation remains 50% C-Fund and 50% S-Fund.
Thank you
-Bill Pritchard
