Long awaited Update


Hello Everybody

My last update was January 22, 2019, which means that we are more than one month (my average update time) between updates…my sincere apologies.

I am inclined to provide the “Sir Sandwich” answer (with “No Excuse” in the middle) which I learned as a young cadet at Texas A&M, 30 years ago (ouch), however I will add that my “off duty life” at this stage is pretty darn busy-  I might as well put an Uber driver sticker on the family SUV.  As such, some time has elapsed between updates.

Moving forward, my personal TSP Allocation is shockingly not any different from the last update.  I remain 100% G-Fund.   Before I share my opinion on what is driving the markets, let me say that my entry and exit criteria for the markets is largely summed up into a few simple concepts, one of which is “Has the condition/situation that prompted you to move [Into/Out of] stocks reversed?”  Being able to clearly answer that question is important.  This situation is assessed using both technical (chart) data and economic (fundamental) data, with the weighting towards the charts.   Recall the market sell-off in February 2018, discussed in a prior post.

Back in February 2018, some asked me “why don’t you get out” or “isn’t it time for the G Fund.”  As you may recall, I remained in stock funds due to my assessment of the backdrop, the bigger picture.   The momentary crash in Feb 2018 subsequently reversed itself.  The inverse question, and situation happening now (in my opinion) is (interestingly enough, one year later) that the markets are rallying.   Now the questions I get are “Shouldn’t you get back in” and “Isn’t it time for stock funds.”   However, now, like back in February, my opinion is that my current TSP Allocation should remain, for now, unchanged.   Clear as mud ?   Let’s talk about this and clear up some mud…

As discussed in prior posts, the major challenges to the markets right now (indeed, they are going higher:  Elon Musk’s Falcon 9 rocket blasted off the pad pretty nicely also, but I am glad I didn’t hitch a ride) include the following:

Rising Interest Rates: a necessary evil when the economy is recovering

Trade Wars/Tariff Disputes with China: March-1 agreement “hard deadline” is now deleted, and progress is not clear

Slowing US Economy:  Some data, specifically GDP and Housing data, reflects a slowing economy

Political infighting at all levels:  “Just do your job” seems to be forgotten.

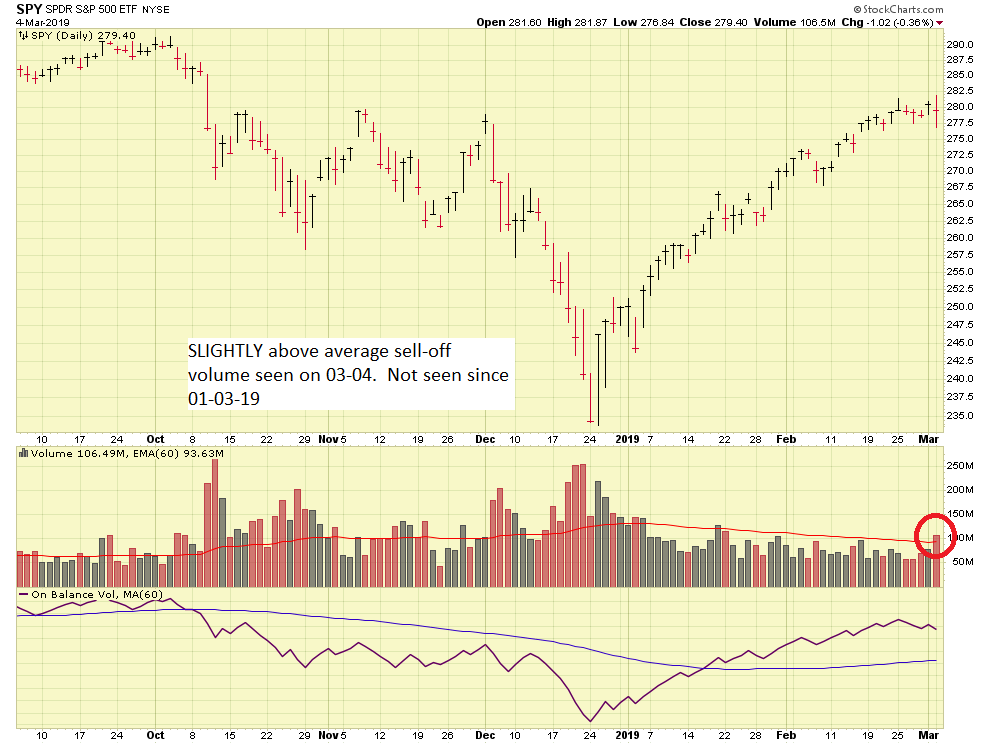
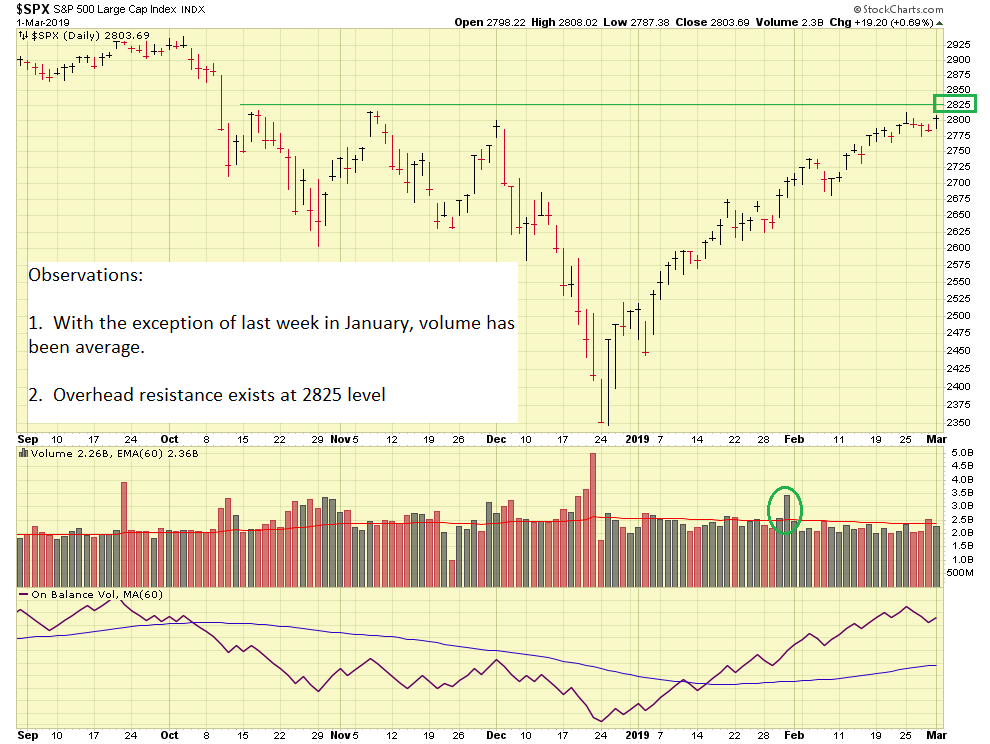
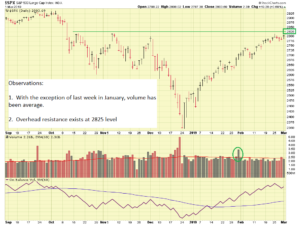
Let’s look at recent S&P 500 action, my benchmark barometer for the markets.  This index contains 500 companies, both from the NASDAQ and NYSE, in a variety of industries, to include technology, energy, healthcare, and others.  Here is a chart of the S&P 500 and the SPY ETF, which “tracks” the S&P 500 index.
“Bill, you sure are becoming a chicken, can’t you see the markets are up” a coworker grumbles to me as I reach for the coffee pot in the break room.

Plain as day is the fact that yes, the index is up.  Also apparent, to me at least, is that volume is average.  Without volume to sustain the action, things can fall apart.  What Mr. Market gives, Mr. Market can very quickly take, if the volume is not there.   Important to note is that the 2825 level is a key overhead resistance level.  This level was approached in 2018 on October 17, November 7, December 3, and in 2019 on February 25 thru present.  In all cases, the level was approached but not penetrated, with the index falling back lower.  A positive, convincing penetration of this level, with a closing price at or above 2825 would do a lot for my confidence.

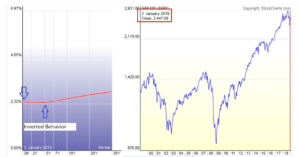
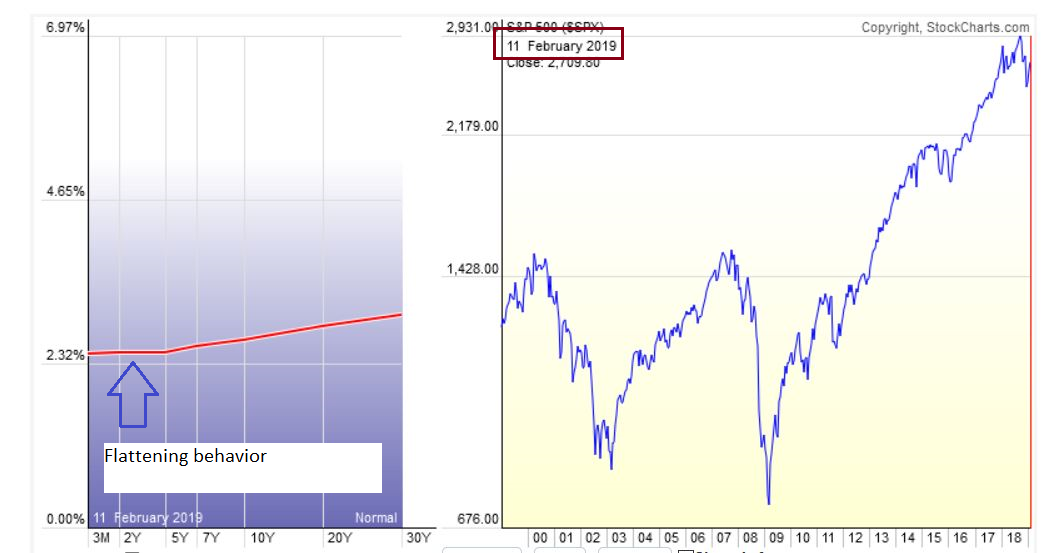
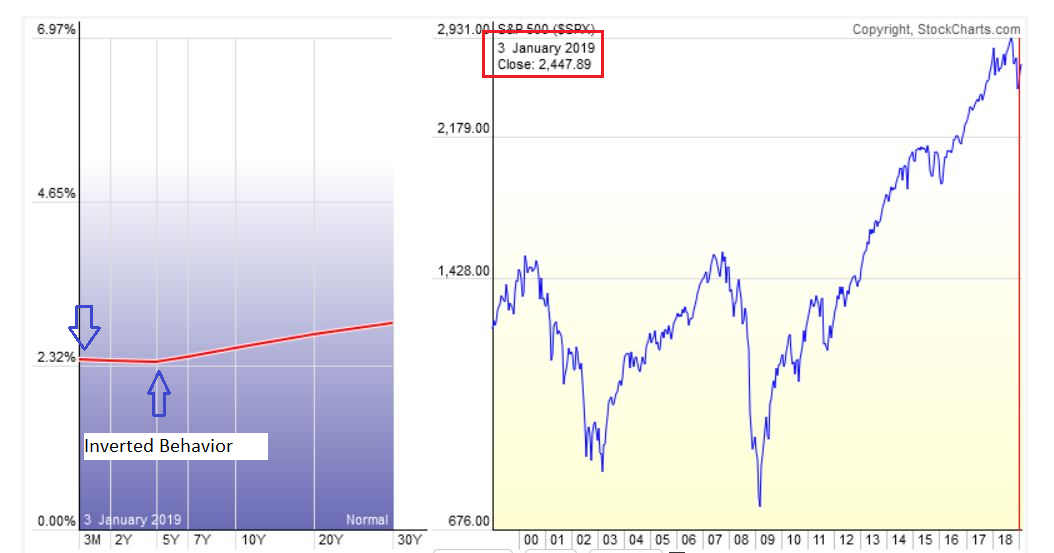
Let’s talk about some “backdrop” and “structural stuff”.    The Yield Curve has displayed a tendency to “go flat” and “inverted” which is one in which the shorter-term bond yields are higher than the longer-term yields, which can be (not always) a sign of upcoming recession.   Some recent images below:
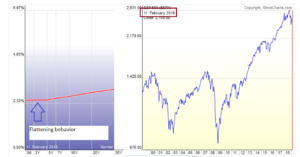
For a pretty good unbiased explanation of this behavior, the Wall Street Journal has a video at this link

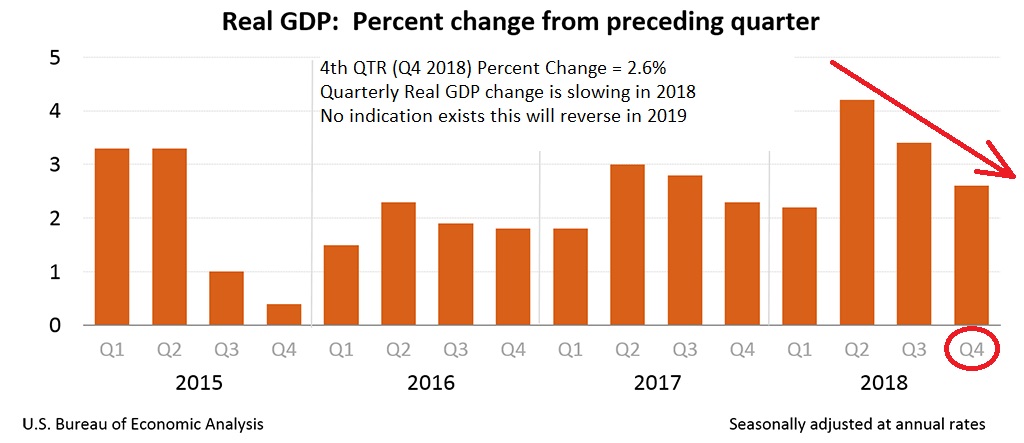
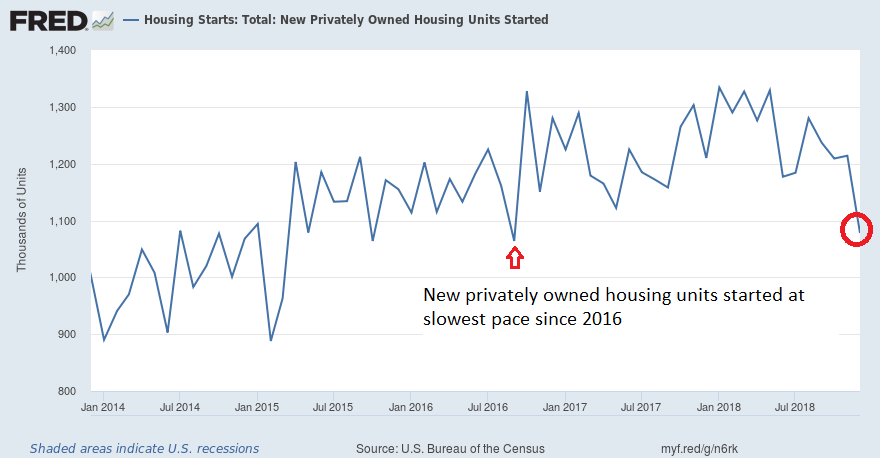
Moving beyond yield curves, less cryptic indicators include GDP and Housing data:
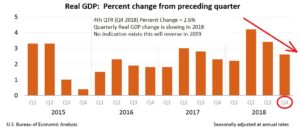
Due to the government shutdown, GDP data was delayed, however Fourth Quarter 2018 (4Q) GDP came in at 2.6% percent change, reflecting a slowing GDP growth for 2018, and ostensibly, a slowing economy.

Moving into housing, home building starts fell to a more than two-year low in December as construction of new homes declined, the latest indication that economy may be losing momentum:
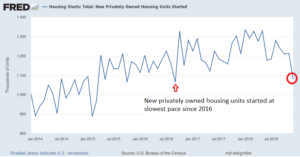
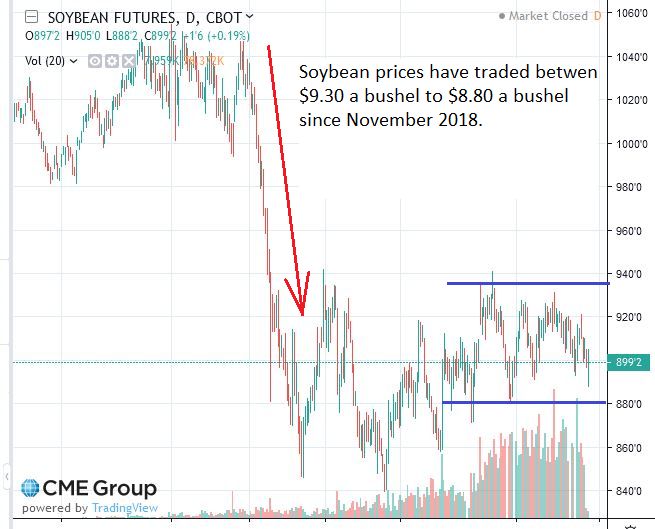
Now that I have touched on some economic red flags, let me discuss the US/China Tariff situation.  As many know, some of the things President Trump wants is to stop intellectual property theft, prevent technology transfer, and desires additional US investment to be permitted inside of China.  China’s only response so far is an agreement to buy more soybeans. This is being “presented” by politicians as a “good faith effort” by China but the fact remains that this was not part of the original proposal, nor is it known if US farmers can even produce the soybeans soon to be requested by China.  “Hey we asked, they couldn’t deliver” may be soon heard inside China’s Presidential Palace.  One would think credible pending orders and demand may impact prices- this “huge breakthrough” is being trumpeted as being good for the US farmer, but impact on soybean prices has been minimal:
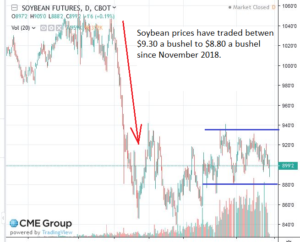
Note that the previously discussed “hard date” of March 1 as a Chinese trade deadline is now two days into the past; missing a deadline is not a positive sign.   The next round of talks is a reported “US-China Summit” on March 27, 2019, to occur in Washington DC.

In summary, I remain 100% G-Fund in my TSP.   As a friendly reminder, what you do with your TSP is your business, if you feel you are “missing gains” or believe in your heart that G-Fund is not appropriate for you, that is entirely understandable.  This free site represents my opinion and personal analysis of things.  With that said, if the S&P 500 breaks 2825, and we have a US/China trade agreement finalized, and economic data does not worsen, I will most likely return to stock funds.  I can almost guarantee you that over a hundred professional investment managers, controlling mutual funds, hedge funds, and large accounts, are thinking exactly the same thing.  This may explain the lackluster volume in the markets.  The year has started well, but I believe some bona-fide “other stuff” exists which may impact things.  For those captivated by “strong lift-offs”, please look at Elon Musk’s Falcon 9 rocket lift off video and Super Bowl LI, when the Atlanta Falcons started very strong.  In both stories, the start did not write the ending.

I am 100% G-Fund in my personal TSP.   Thanks for reading, and please share with your friends and colleagues.   Next post hopefully sooner than five weeks away….

Thank you

-Bill Pritchard



Global slowdown fears Remain


Good Evening

We are now sufficiently into January 2019, with 2.5 weeks of trading action behind us, enough time for an assessment of the action.  A development since my last post on December 22, 2018: the still unresolved government shutdown, a situation impacting almost all of the subscriber-ship to this website.  For me (and speaking only for me, myself, and I…) the concept of “protect what you have” aka including the G-Fund in your toolbox of tools, rings loudly.   Unless I missed a memo, folks are not receiving paychecks, nor are they making any TSP contributions, nor receiving agency matching.  This is also why I advocate pushing the gas pedal all the way to the floor, when the conditions warrant, and pulling off the road when too many hazards are in the path ahead.  Indeed this may not work for all, but it helps me sleep at night: having left the stock funds back in October, my TSP is largely intact as we enter government shutdown Day #32.

Indeed the markets rallied (some) since December 26, 2018.   Many messaged me on Twitter or LinkedIn and asked if we are “missing out” on gains etc, but as I have discussed in the past, I am not day-trading my TSP, I am looking at larger trends, both on an economic basis (“backdrop” or the “climate”) and on a technical basis (chart patterns, trends, etc.).   My usually broken crystal ball looks at 90-day to annual trends, not one day to the next.   If the Dow drops 1,000 points in one day, sure that is an “attention-getter” but it only prompts me to look at larger scale action.

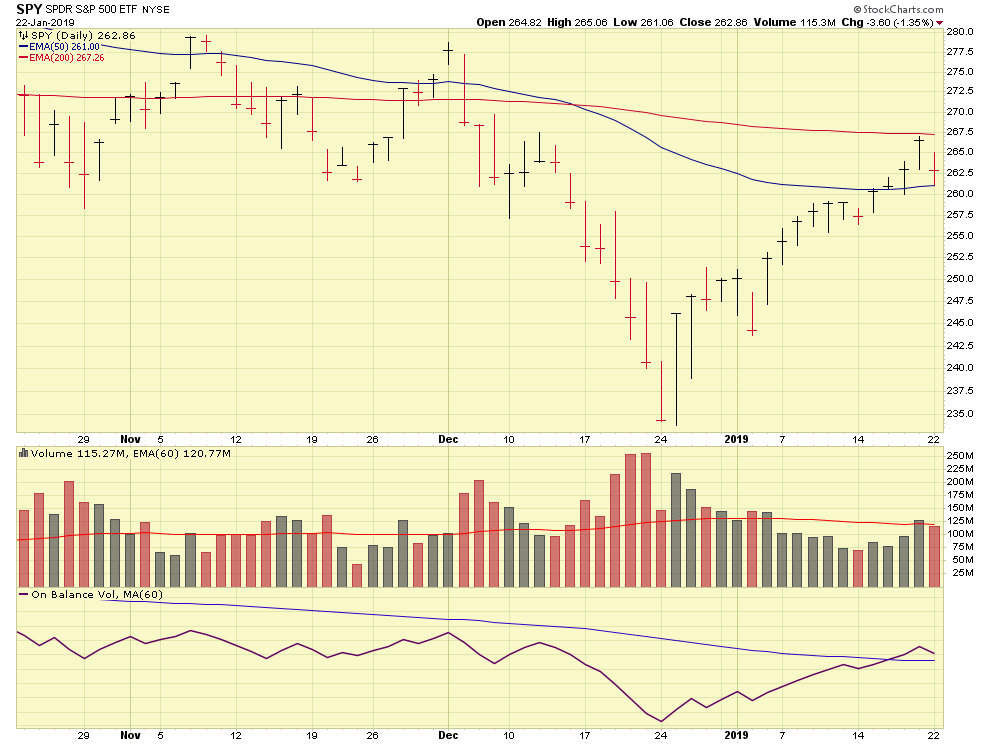
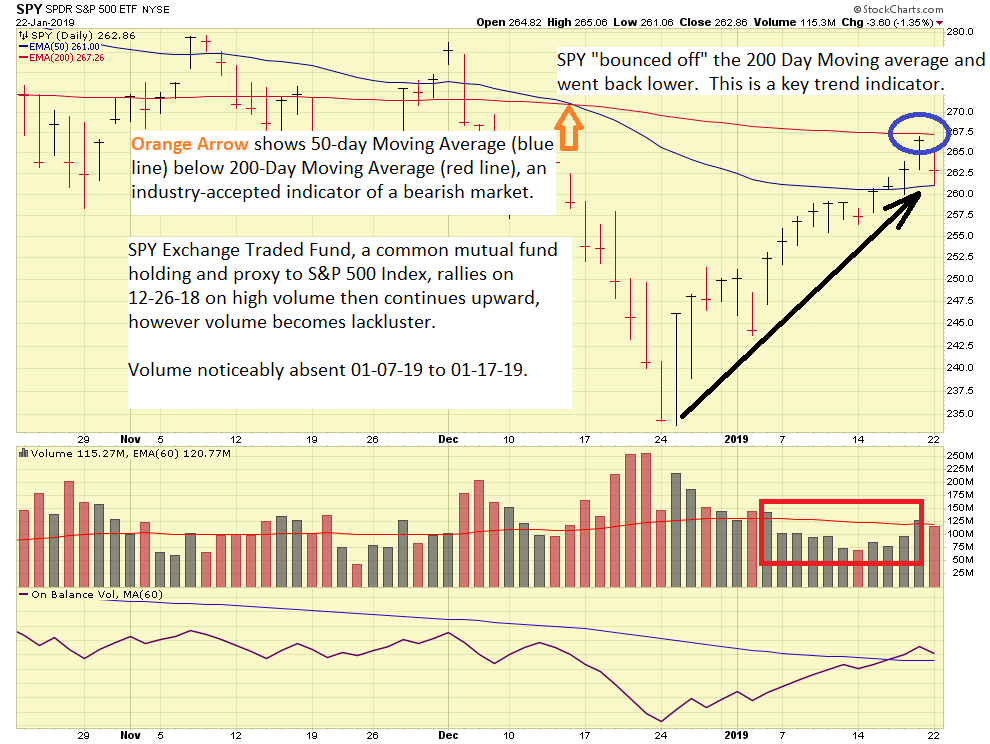
Moving forward, lets bring up some charts of the SPY Exchange Traded Fund (ETF).  This ETF is a very popular “proxy” investment vehicle to the S&P 500 Index, my default market barometer, and provides excellent volume and trend analysis of things.  Almost every mutual fund on the planet owns some SPY shares.  Note that the Dow Jones Index is heavily watched by the financial press, but it is only 30 stocks and does not represent the overall market.

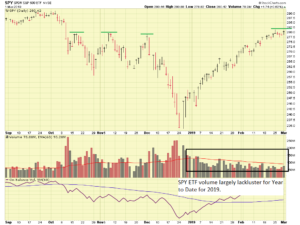
As can be seen above, there is a lack of trading volume from January 7, 2019 thru January 17, 2019.  While markets can go down on their own (on low volume), they need volume to sustain vertical movement.  Volume has deteriorated since the rally on December 26, 2018.  Some have questioned “who” was behind the December 26 move, as most of Wall Street was out on Christmas break.  One thing is certain, since returning from break, volumes have not picked up.

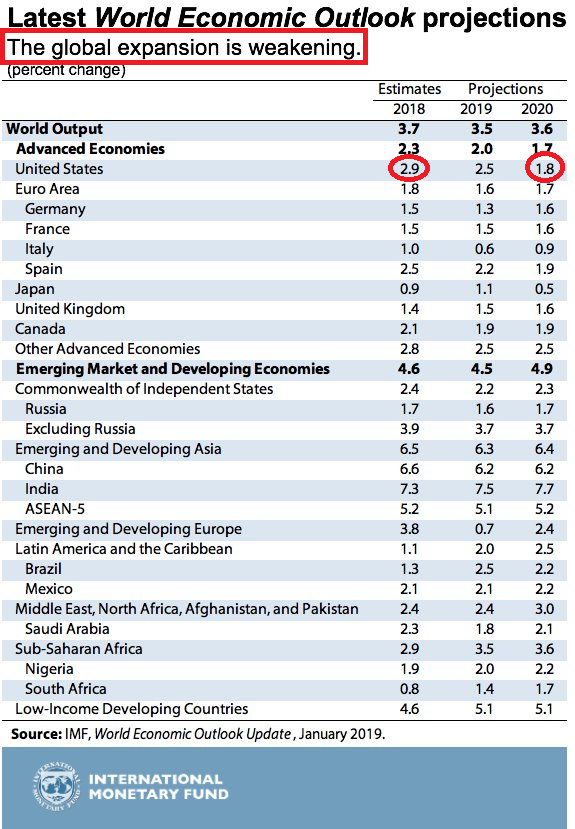
On the economic front, a few events have occurred since January 1, 2019.   We are currently in the middle of the World Economic Forum, held each year in Davos, Switzerland.  The largest concern appears to be a believed global economic slowdown, with a slowdown forecasted in United States, amongst other countries.  The International Monetary Fund (IMF) recently released its World Economic Outlook, and stated that “…the global expansion is weakening and at a rate that is somewhat faster than expected.”

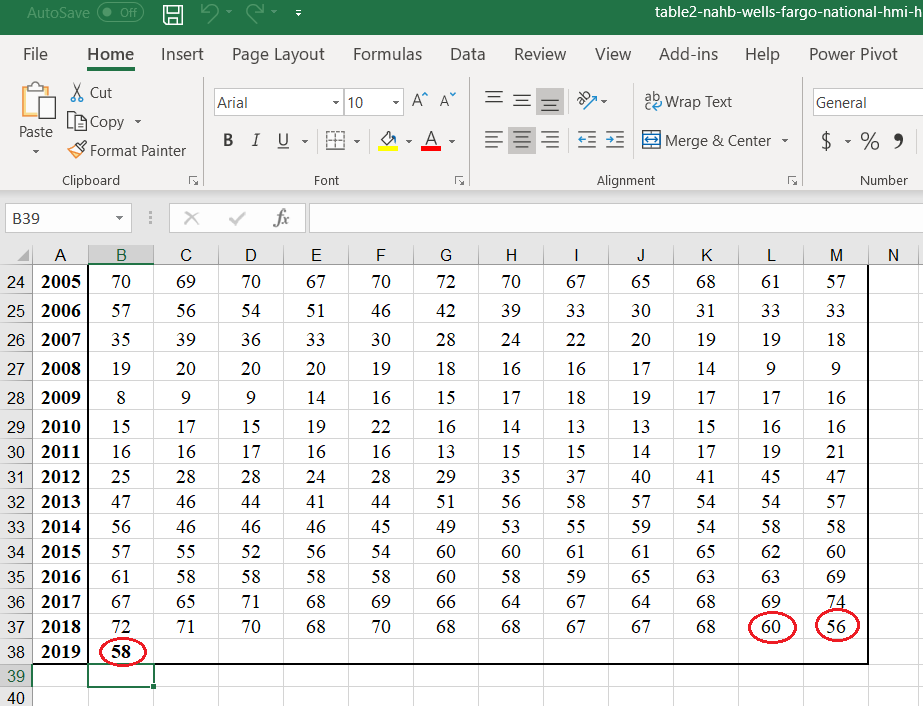
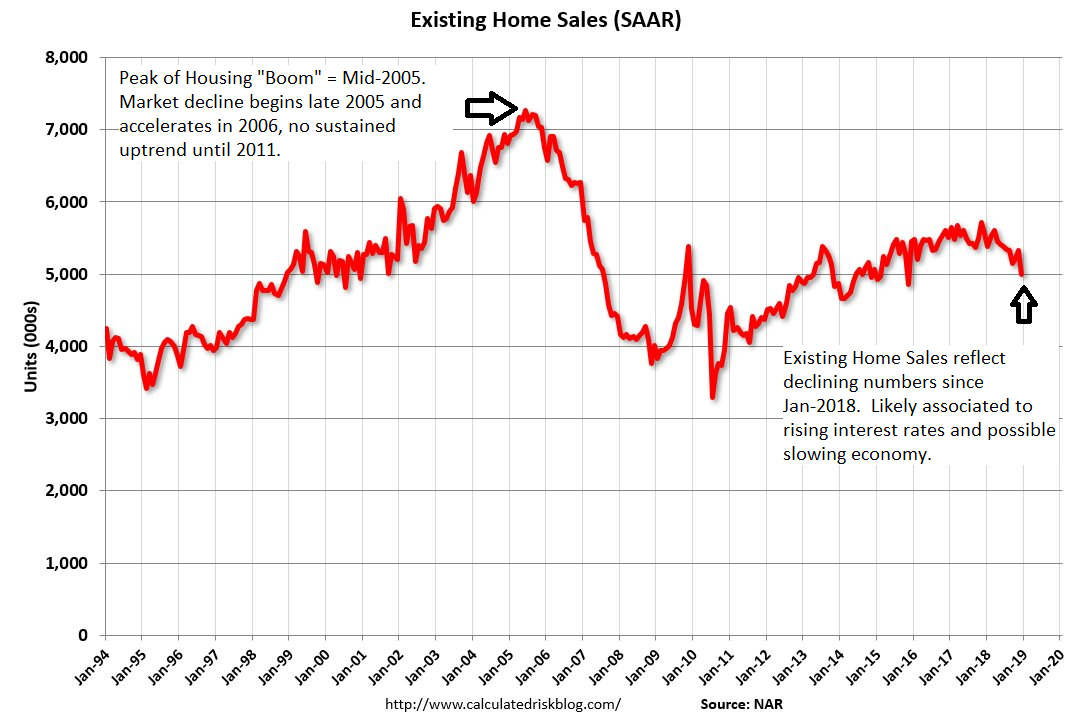
Additional negative signals exist, notably weaker housing data, with slowing home sales as reported by the National Association of Realtors (NAR) and a weakening in housing sentiment, as measured by the Housing Market Index, published by the NAHB, the National Association of Home Builders.  My point:  Two different real estate groups are both reporting a slowdown.  Charts/Graphics below, including of the screenshot of my excel file.

The excel file reflects deteriorating sentiment (scale from 1-100, the higher the more positive the sentiment) which began in November 2018.

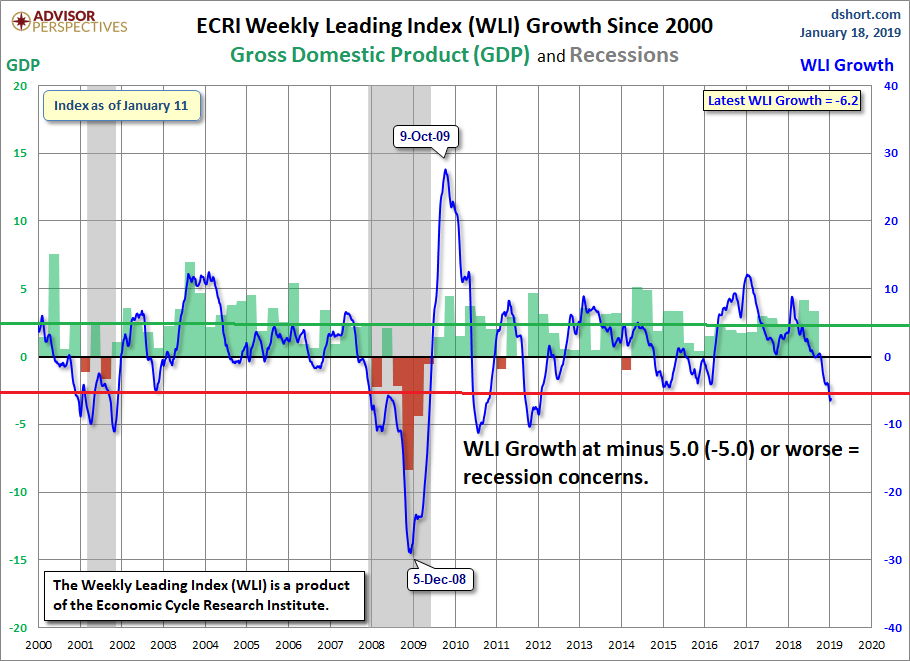
An additional tool that I have begun to embrace (never stop learning…) is called the Economic Cycle Research Institute (ECRI) Weekly Leading Index.  This is a proprietary chart which has proven to be highly accurate at forecasting recessions.  Note, historically the stock market will crash before a recession is declared, the declaration being the responsibility of the National Bureau of Economic Research.  A primary component of a recession is negative GDP, which we do not have.  Based on the behavior of the Weekly Leading Index, some concerns for a recession do exist.

Finally, political tensions continue to play a role in the mood of the markets.  For the purpose of this category, I will include trade wars/tariffs.  I will attempt to remain agnostic, however suffice it to say that grown adults (we are talking age 65+), from both parties, need to come together and work out a solution.  A closed government, with employees literally “paying the price” for elected officials who cannot reach an agreement, is not the solution.  I simply cannot see how a closed government solves anything.  How are we expected to negotiate trade deals with China and make peacekeeping strides with hostile nations if we cannot even agree with each other in our Capitol ?

Some economists believe the shutdown costs the economy $1 Billion a day.  Marriott International recently stated that they are seeing “double-digit declines” in occupancy rates in their hotels, and Delta Airlines stated (on Jan 15) that the shutdown had cost the airline $25M in lost revenue.  This figure will likely be $50M+ if the shutdown continues.   The human cost to employees and their families cannot be measured…I hope and pray that the shutdown is resolved soon.

In summary, my TSP remains 100% G-Fund.

Thank you for reading-  if you find value and have benefited from my analysis of things, please share my site with your friends, coworkers, and colleagues.

-Bill Pritchard


This is a Bear Market, not a Correction


Well, I promised to be “off the air” but I when I watch the various financial websites claim we are “in a correction” it really gets my rockets going.   Saying we are in a “correction” would be like calling the ER via radio, enroute Code-3, with a bullet wound victim in one stretcher, and a paper cut victim in the other stretcher, and saying you are inbound with two blood loss victims.

The below definitions are “generally accepted” definitions used in the professional investment world:

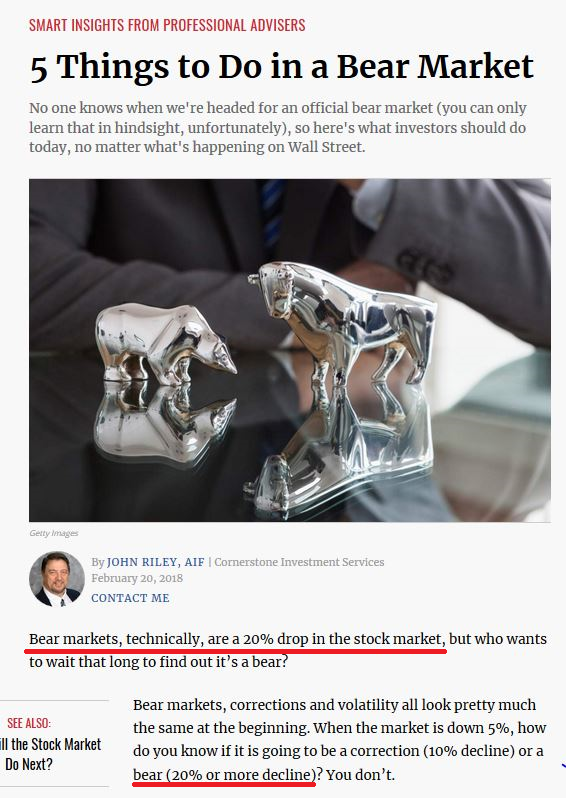
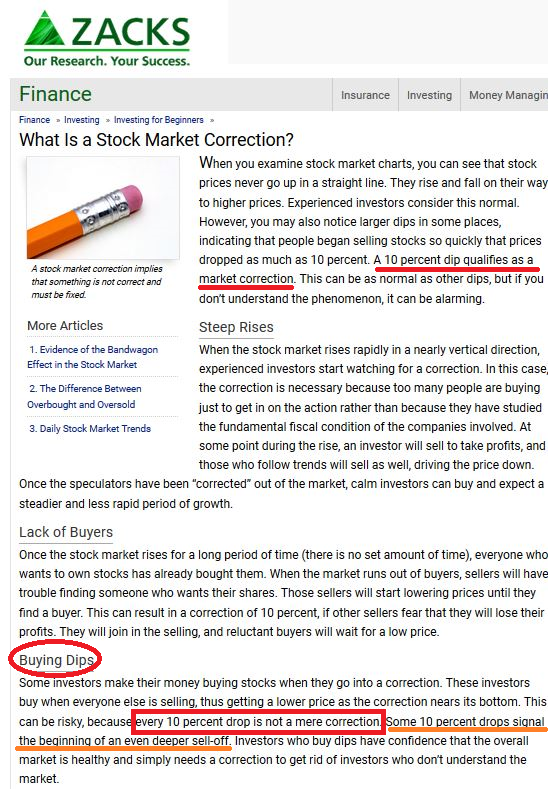
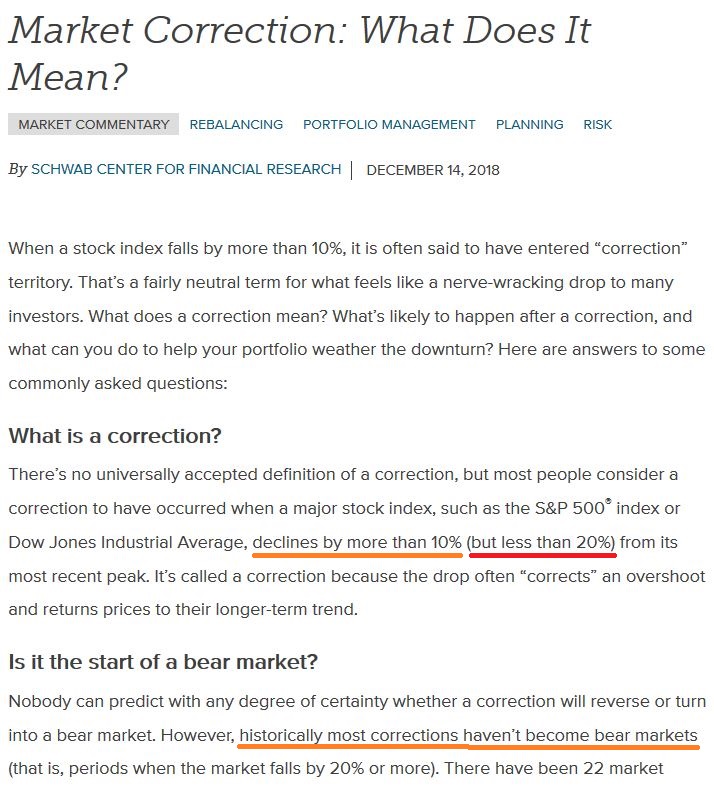
Correction:  A loss in 10%, from the high, but below 20%, in an index.  Indeed these happen on a semi-frequent basis, the February 2018 market displayed this, note that I remained in stock funds in my personal TSP.

Bear Market:  A loss of 20%, or more, in an index.  (Indeed, to get to 20%, you must break 10%).  Also associated with oft-used dystopian terms such as “crash” / “meltdown” / “crisis” / etc.  These are infrequent in nature.

I see many sites claiming “this is a correction” , “a mere correction” , “after this correction, it will rebound”  etc.

For the record, Dow Jones Index and NASDAQ are both in Bear Markets.   The S&P 500, currently with a 17.8% loss, is close to a Bear Market.   Please see below images from Kiplingers, Zacks Finance, and Charles Schwab, all respected and well known in the investment sector.

Hope this clarifies the difference….Merry Christmas….going “off the air” (second attempt…)

-Bill Pritchard
 

Markets continue to Crash


Good Evening

As most know, the markets continued to crash this past week. Faced with the concerns of global economic slowdown, political uncertainty, rising interest rates, and an unknown tariff/trade situation, the market direction was not-surprisingly downward.  Note that in late October, I made the decision to move to G-Fund: this resulted in some minor scrapes and bruises on the way out, but I am pleased to be in the safety of the G-Fund while things continue to fall apart two months later.    Important to note that of all the various “TSP information sites” (Twitter, Websites, Etc) out there, this free one appears to be the only which correctly “called things.”

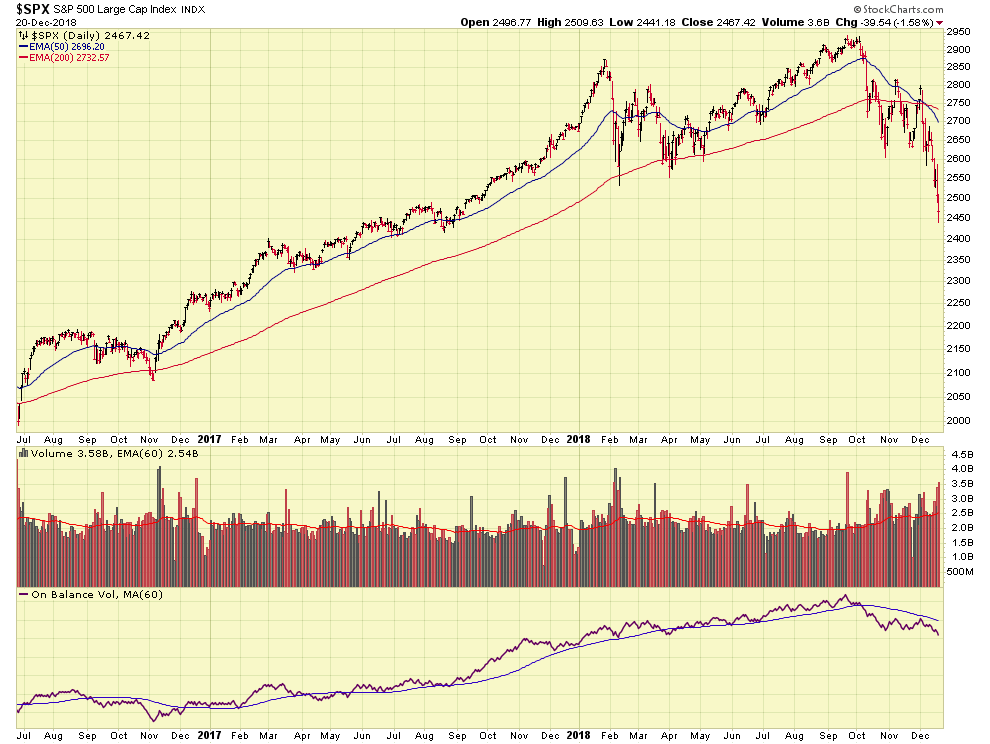
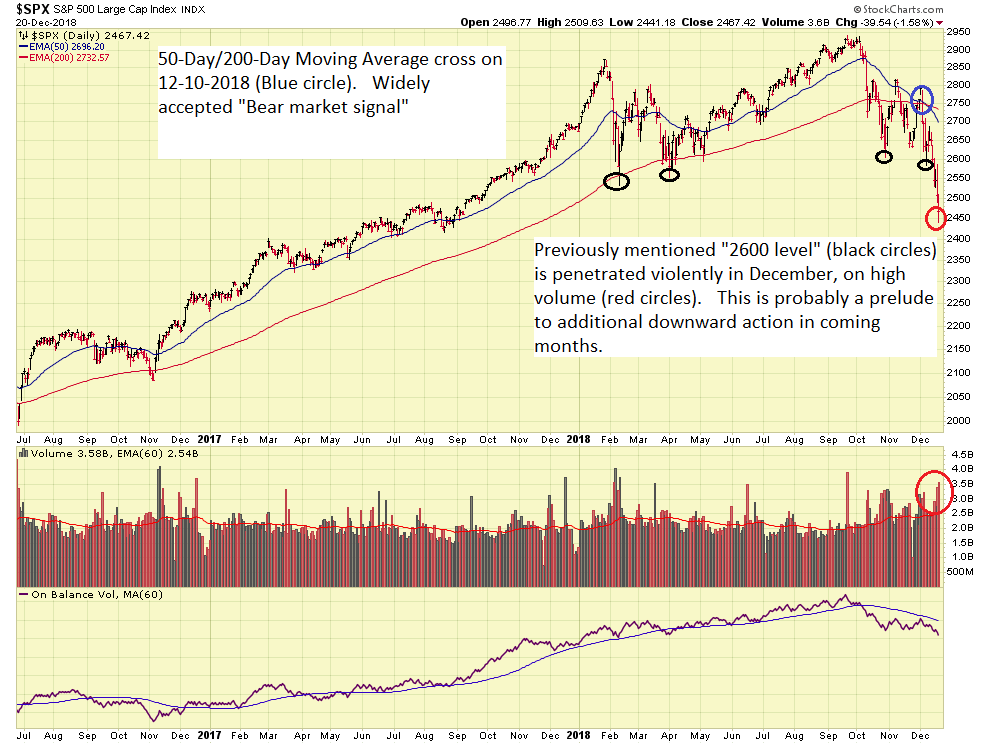
I made previous references to “the bottom falling out” of things, and apparently this has indeed begun.  The S&P 500 index is at all time lows for the year, and has “broken thru” the 2600 support level.  Additionally, the often watched “Bear Signal”, the 50-day and 200-day Moving Average cross, has occurred, on December 10.   See charts:

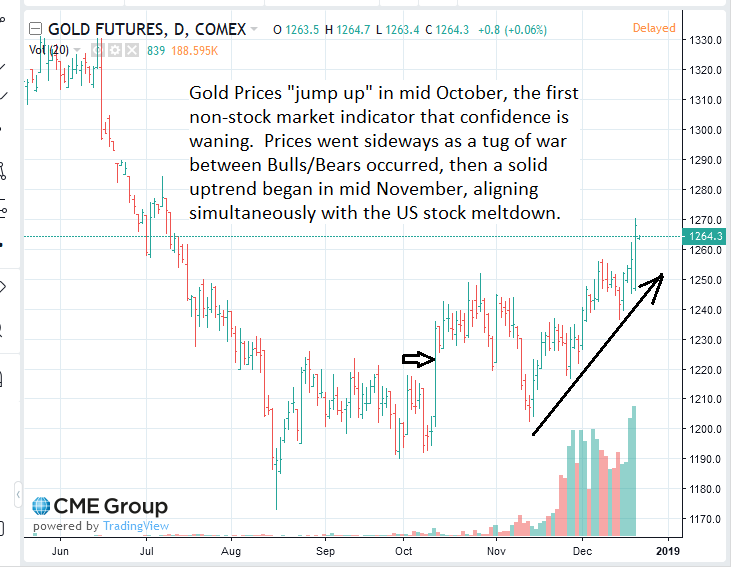
A “supportive indicator” of my Bearish opinion is the price of Gold.  Gold, a safe-haven currency, typically goes up when things are down elsewhere.   Also, because of its safe-haven nature, moves in Gold typically don’t happen as a result from a one week stock market panic, or because Facebook stock crashes.  Gold does not care about that.  Historically (not all the time, no indicator is guaranteed to be perfect…) gold moves when the wide-ranging consensus amongst bankers, economists, hedge funds, etc. is ominous.   Chart below:

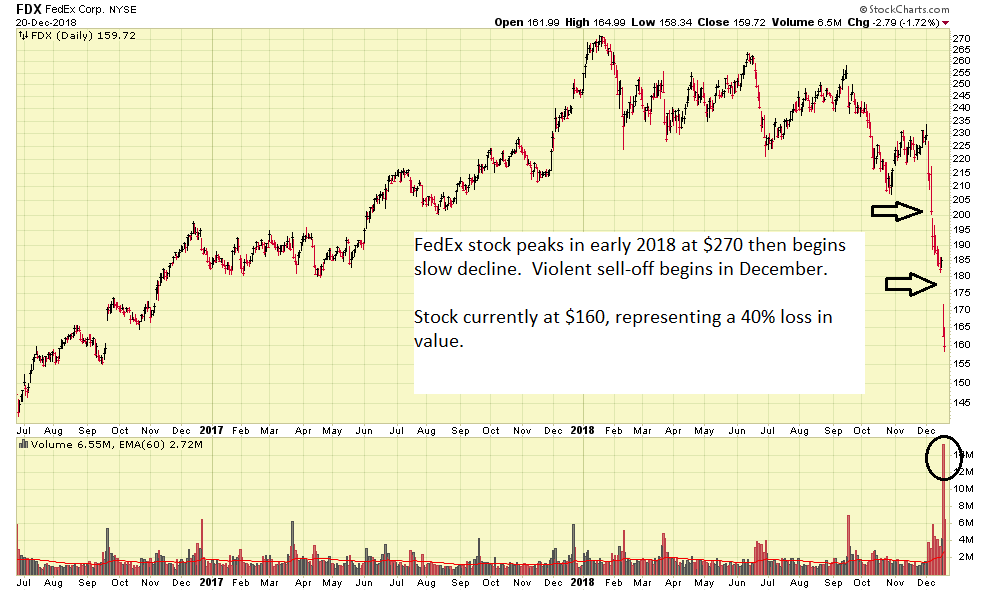
Why is all this happening ?  I offer only my opinion, and do not claim to have some sort of magical crystal ball or secret recipe, but as stated above (and in past posts…), economic slowdown, tariff concerns, and interest rate hikes are all causing angst.    Ever heard of the company Federal Express (FedEx) ?  One could argue that FedEx is probably one of the “always-will-be-there” companies, possibly more secure than the federal government itself.   Lets take a look at their stock chart:

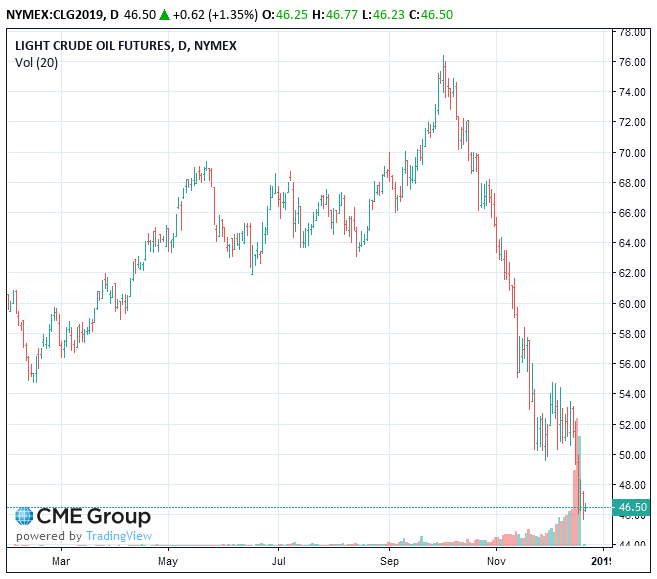
Apparent is the huge decline in the stock since January 2018, a loss of 40% in value.  FedEx, n US company (Memphis, TN), however indeed has “global exposure” due to shipping all over the world.   Some believe FedEx is a “proxy” for economic conditions.    We know that oil prices are not impacting FedEx, oil is at all time lows for 2018: $47 a barrel.  See Chart:

Cheap oil is fine for the retail consumer, mom and dad, who want to make that road trip, but big-picture wise, super cheap crude oil is bad for the industry.   I wrote about this in January 13, 2017 , expressing that $55-$65 is the “happy spot” which keeps prices at the retail pump fairly cheap, while still allowing oil companies to make a profit (and keep workers employed; all of them buy houses, cars, and spend money).  Many believe extended declines in oil are leading indicators for a recession.

On December 17, 2018, Houston Chronicle energy reported Jordan Blum echoed my sentiment that I made almost 24 months prior, stating that “…The dip below the $50 threshold places prices just below what’s considered necessary for most energy firms to make money…”  Pleased to see industry analysts come to the same conclusion as me, I also believe that layoffs in the oil sector would be problematic for the economy.   Why is oil crashing ?  It is all supply and demand.  If OPEC and other groups choose to “up” oil production, the supply grows, if they dial it back, supply comes down.   Demand consumes that supply.  If demand exceeds supply output, prices increase.

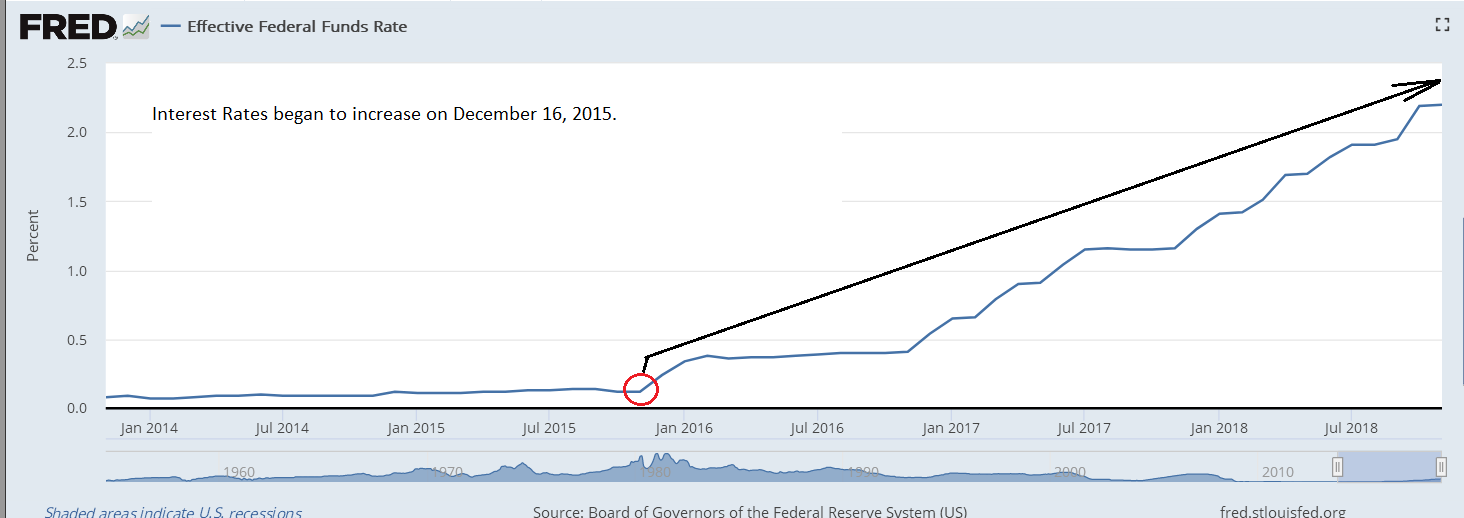
Regarding interest rates, the markets for some reason expected no rate hike in December, however as I anticipated, FOMC Chairman indeed delivered one.  Right, wrong, or indifferent, it is what it is:  a rising interest rate climate.   Low (or zero) interest rates are the medicine for the sick patient.  If the patient improves, the doctor reduces the medicine.   The medicine reductions began on December 16, 2015 , as interest rates began their rise:

Note that we cannot eat our cake, and have it too.   On one hand, we have politicians and others, bragging about the hot economy and “the great numbers coming in [data]” , but then we don’t like it when the FOMC raises rates, because, well, the patient is recovering and the medicine should be dialed back.  I do not offer any solutions to this, interest rates and investment dynamics are a complicated matter, if you need to sleep, a 99 page Harvard white paper which you can attempt to decipher exists at this link.

Note that the markets will be closed on December 25 and January 1.   They will be on a short trading day on December 24.   As such, expect much lower volumes in the markets over the next two weeks.   I too, will turn my attention away from the markets, and enjoy some family time during the holidays.  Barring exigent circumstances, I do not plan on another update for another couple of weeks.

I remain 100% G-Fund.  As a reminder, the G-Fund is an investment option if you would like to have all or a portion of your TSP account completely protected from loss. If you choose to invest in the G Fund, you are placing a higher priority on the stability and preservation of your money than on the opportunity to potentially achieve greater long-term growth in your account through investment in the other TSP funds.  Additional official guidance published on the TSP site:  https://www.tsp.gov/InvestmentFunds/FundOptions/fundPerformance_G.html

I wish everyone a Merry Christmas and Happy New Year.

-Bill Pritchard


Markets continue into the Red


Hello Folks

As most know, markets have gone deeper into the red.   The Dow Jones Index performed as follows:

12-7-18:    -558.72 Points

12-6-18:   -79.40 points

12-4-18:  -799.36 points

12-3-18:  +287 points (NOTE:  this is the day after reported “successful” Sunday meeting with China at G-20, and numerous messages from readers of this free site, asking me “if we are missing gains” and “maybe I am delaying too long” etc etc, “the G-20 summit is over, now what” etc etc.  “When are you gonna send out a new update?” etc.)   The rest of the week these messages mysteriously ceased, as the Dow crashed.

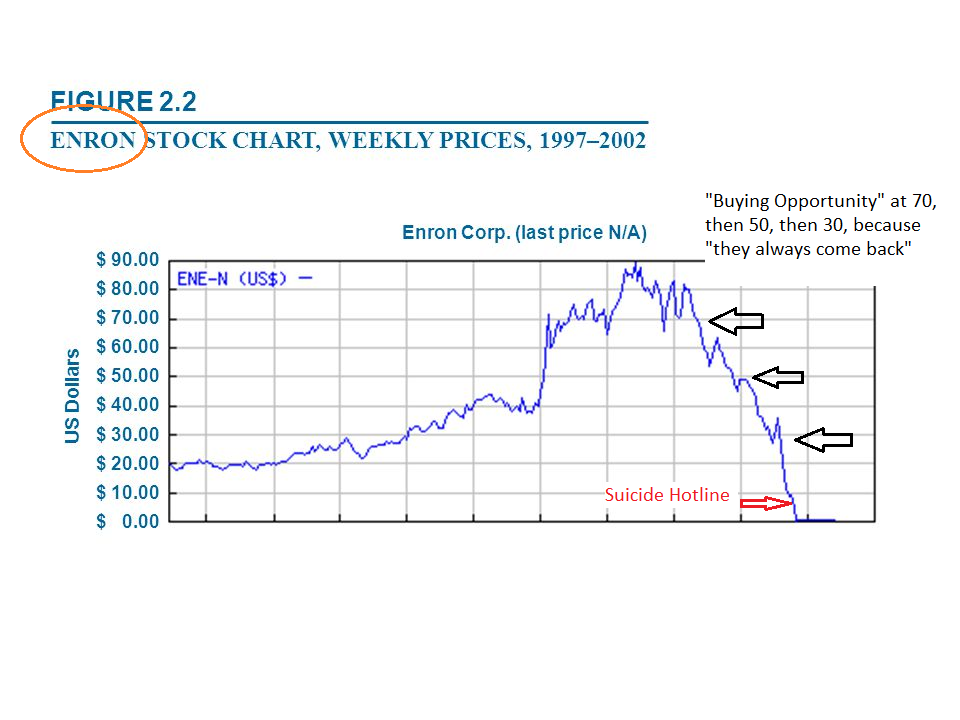
You may recall my evening post on 12-2-18, indicating why I am not comfortable returning to stock funds, as I prefer to continue to monitor things.   The Dow subsequently lost almost 1,500 points by the end of the week, I would say my nervousness was (once again…) justified.   Note I initially left the Titanic back in late October, and since then, things have not gotten any better.  It is quite interesting to see “other” sites continue to claim that this is a “buying opportunity” and that “things always come back.”   A frequently followed twitter feed of another site posted that “things are bouncing back soon” or something to that effect.  I asked them what information they have to come to that conclusion, and my inquiry was met with (not shockingly…) radio silence.  So for the majority of the folks in the press and on the other TSP sites, who apparently do not understand things, the easy answer is “do nothing” and “ride it out.”   Because, well, this is a temporary hiccup, and “things always bounce back.”  Sure, so do forests after a forest fire.   However can you wait 10 to 20 years for your balance to recover ?    I might add that I don’t think I have ever stated markets will never recover, if someone came to that conclusion, they do not understand my philosophy or are confused on my methods.   My apologies on that.  Lets take a look at a chart of Enron stock, I have inserted my comments onto the chart:

Enron went to zero (0) (value-less), and while the stock market indexes that our TSP funds are based on will never go to zero, the point to be communicated, at least in my view/opinion, is that capital (money) preservation and loss protection is critical.  The G-Fund plays an important role in that strategy.   No, I did not pioneer this idea, the official TSP site also supports it: https://www.tsp.gov/InvestmentFunds/FundOptions/fundPerformance_G.html

The “always bounce back” crowd is swiftly muted when you remind them of Enron, WorldCom, and other (admittedly extreme…) examples.

Lets discuss some recent market action…

As we know, the G-20 summit has concluded and one week later, nobody knows what was discussed or agreed to.  This “messaging” by the involved parties (or lack of messaging) does not serve to allay already existing market nervousness.

Other concerns such as December interest rate hikes, as discussed in my last post, are almost a guarantee, also the mainstream press is talking about the Yield Curve getting flat and inverting.  Note that I made reference on this free site to this topic months ago, in my posts dated July 15, 2018 and August 26, 2018.  I even stated that the Yield Curve was one “leg” supporting the market, if it gets weaker, the market will go down.   Here we are today, with a 1,500 point loss in the Dow.

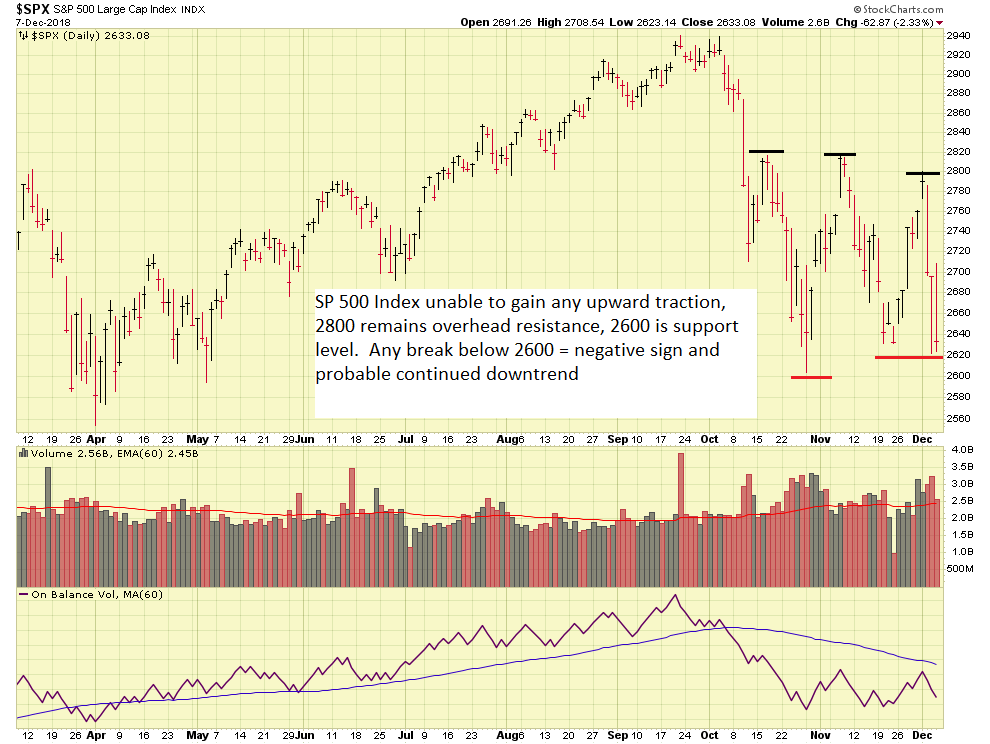
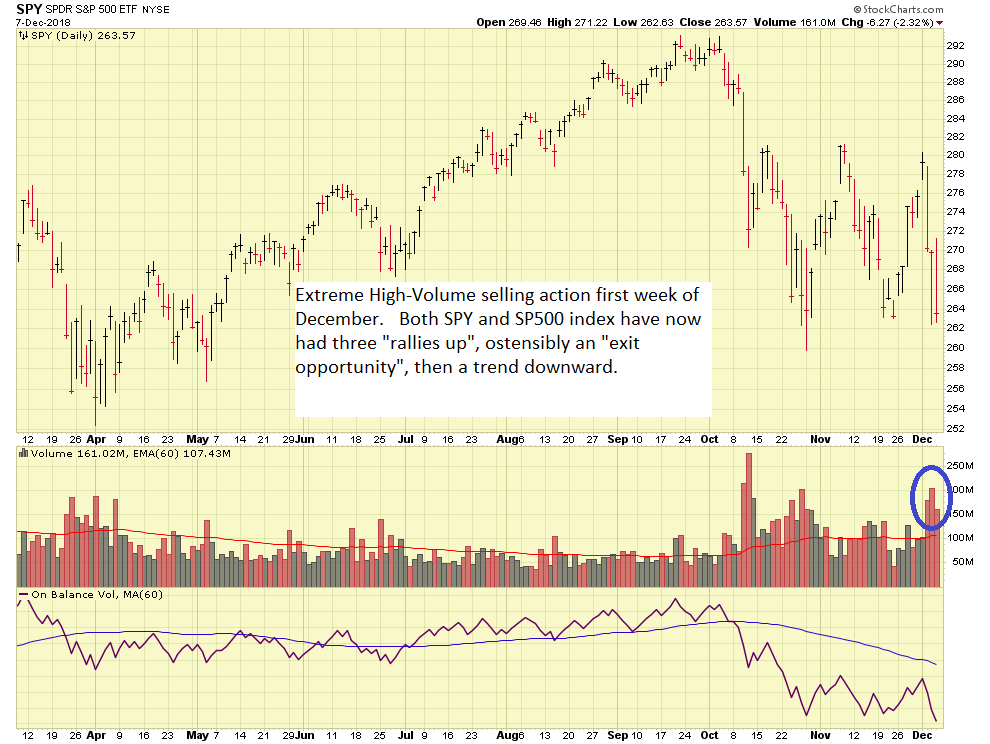
Lets take a look at some charts of the SP 500 Index, and SPY Exchange Traded Fund (ETF), a useful proxy to analyze volume:

Quickly evident is that the 2600 level is our support level for the SP 500, while 2800 is overhead resistance.   Note !   This is a dynamic level and changes over time.   These are current levels, and may not be applicable in six months.  When I discuss levels like these, I am looking at the next 30-90 days.   (Some reader emails have brought this up, hence the FYI).  For now, 2600-2800 is our “zone” we need to watch, if the index goes above 2800, that is great, if it breaks 2600, that is bad.

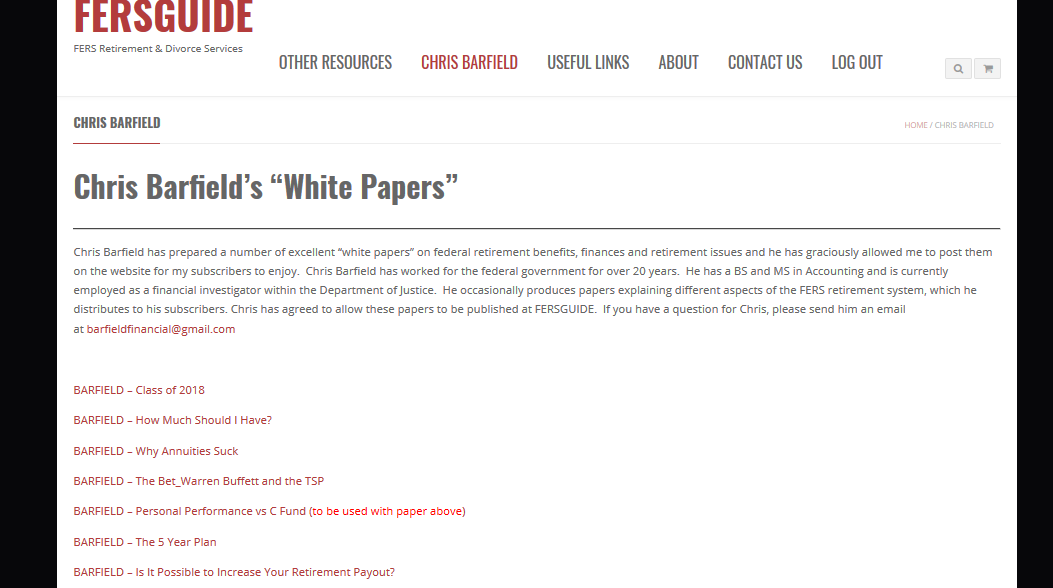
Moving forward, let me promote my colleague Dan Jamison, CPA (and retired FBI Special Agent) of the FERS Guide.  As some may know, the 2019 version has been published, and it is packed full of benefits information.   I personally have great passion about the financial markets and watching the stock indexes, however my attention span tends to quickly drop off when the topics are annuities, life insurance, survivor benefits.    Dan is the answer and explains things is awesome detail, and does so with fluency unmatched anyway else.  Everyone should subscribe to his FERS Guide.   Included on his site are articles by a fellow DOJ’er, Chris Barfield.   These articles discuss the economy in general and common FERS topics, they are excellent and I learned something new from reading them.   A screenshot is below:

Did I say that everyone should be a member/subscriber to Dan Jamison’s FERS Guide?    Sign up is here:  https://fersguide.com/

In conclusion, I remain 100% G-Fund in my TSP.

Thanks for reading…

-Bill Pritchard
 

G-20 is over, Futures Rally, but questions Remain…


Good Evening

I have had quite a few emails and LinkedIn Messages asking for my opinion on the markets.  I simply cannot answer all of them, this is the very reason this site was launched years ago:  mass/bulk communication of my views of the market.   So with that said, allow me to share my views.  Note that I remain 100% G-Fund and plan to continue that allocation for the near future.   

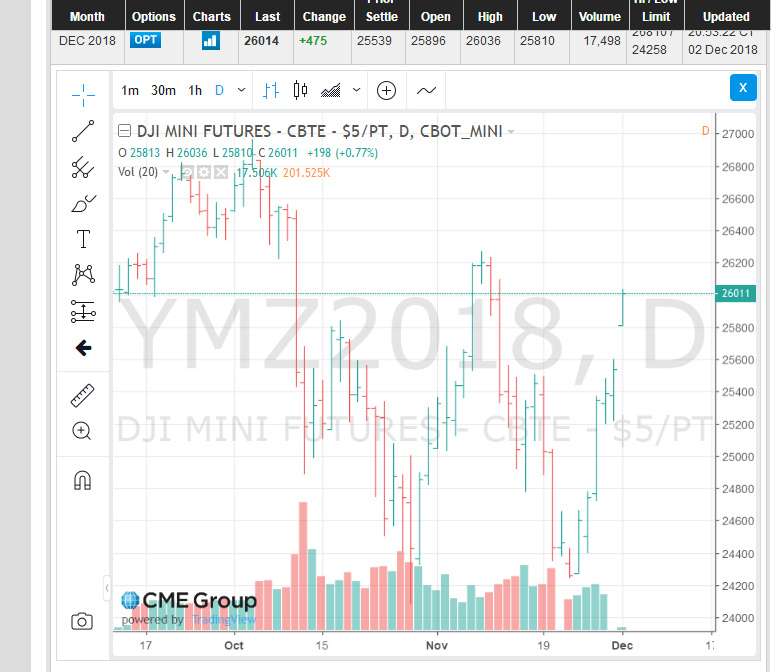
The G-20 summit is “over”, and various news outlets and elected politicians are claiming “progress was made”.  To be fair, the final vote is always Mr. Market, and (for now), the markets, reflected by the futures markets, like it, they are up over 400 points for Dow Jones Futures:

However one can only wonder if this “move” will last, much like recent other “up moves” which failed days later, dragging the markets down further.   In support of that question, I offer the following about the G-20 summit:

Tariffs have not been eliminated (as many originally desired).   The tariffs installed on $200B worth of Chinese goods, back in September, remain intact.

China/US have agreed to “keep talking” and have stated “we had a productive meeting” etc.  These are pleasantries which means “we have not agreed on anything” and “we did not finish” what we needed to get started.  Is it a “start” in the right direction ?  Sure.   Is the problem solved ?  No.  The can has been kicked down the road, for 90-days.

The FOMC will undoubtedly raise rates in December.  100%, absolutely, without a doubt.   Their chairman, Mr. Jerome Powell, recently spoke in front of the Economic Club of New York.   His statements in this social setting were somewhat differently toned that what we see in sworn testimony in front of Congress, or in official press releases.   The statements at the meeting were devoured by hungry members of the media, with some even concluding that rate hikes are “on hold.”   I guarantee nothing is on hold.  Mr. Powell basically said what we already know, a close reading of the statement will reveal that.  Furthermore, he even stated that rates are at historical lows.   Guess what direction they will be headed ?   Up.   The press reported that rate decisions will be “data dependent” (they always have been).  Well the data reflects a super hot economy, low unemployment, and inflation hovering at 2% (a previously identified “target” by former FOMC Janet Yellen).   So the data supports continued rate hikes.

Moving forward, additional preliminary indicators exist that the housing market continues to cool (which happens when mortgage rates increase).   The National Association of Home Builders recent survey reflects optimism is at the lowest point for all of 2018.   Housing is a very reliable leading indicator regarding recessions ahead.

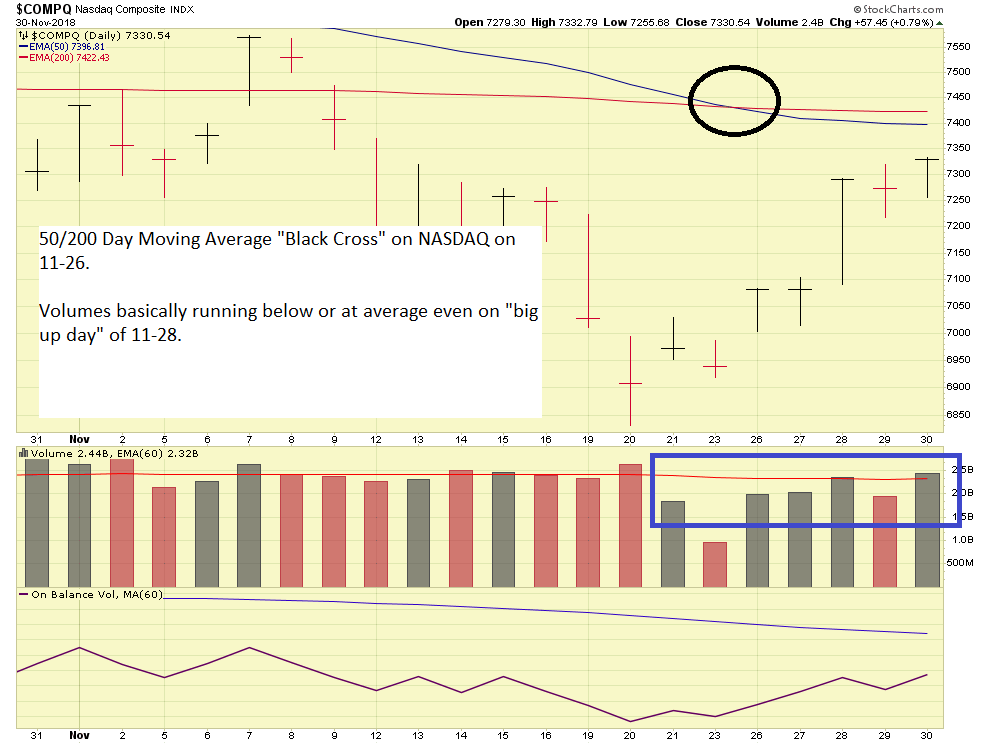
Note that the NASDAQ Index has witnessed its 50 day/200 day Moving Average cross, this is known as a “Black Cross” or “Death Cross” which means the underlying index is entering Bear Market conditions.  See chart:

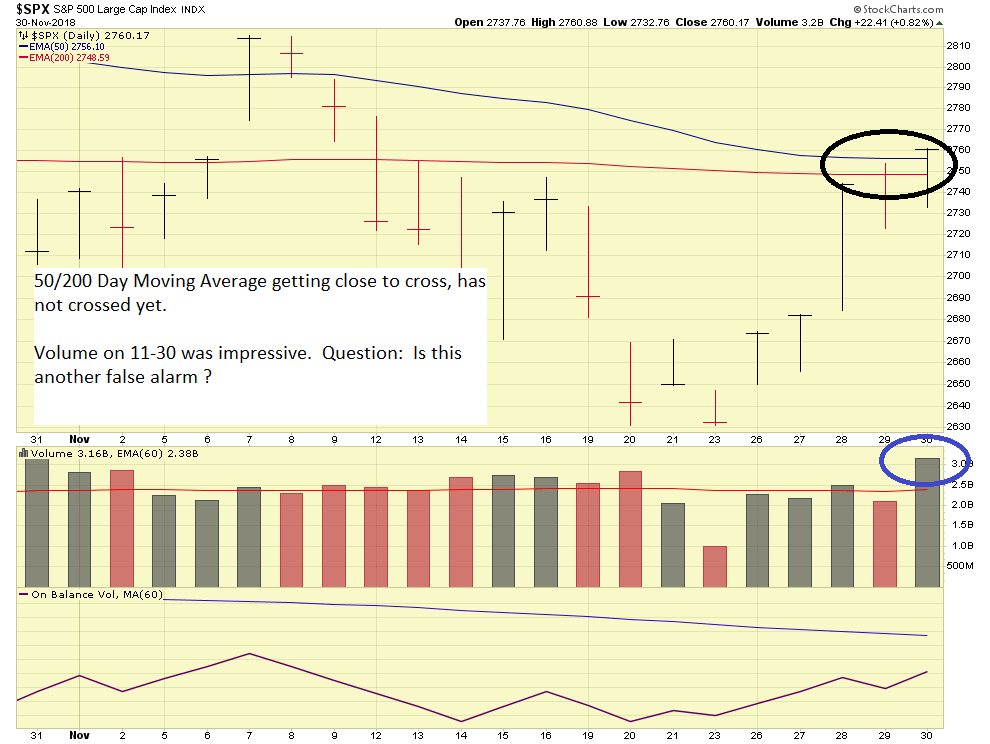
The SP 500 Index, my preferred barometer of things, does not reflect a cross yet, but it is approaching:

In conclusion, I will remain 100% G-Fund for now.   As my disclaimer says, what you do with your TSP is your business.  I still am not comfortable with the climate to wander outside and go back into stock funds, based on the above observations and opinions.

Thank you for reading !    Talk to you soon….

-Bill Pritchard


Mid-Term “rally” reverses Lower


Good Evening Folks

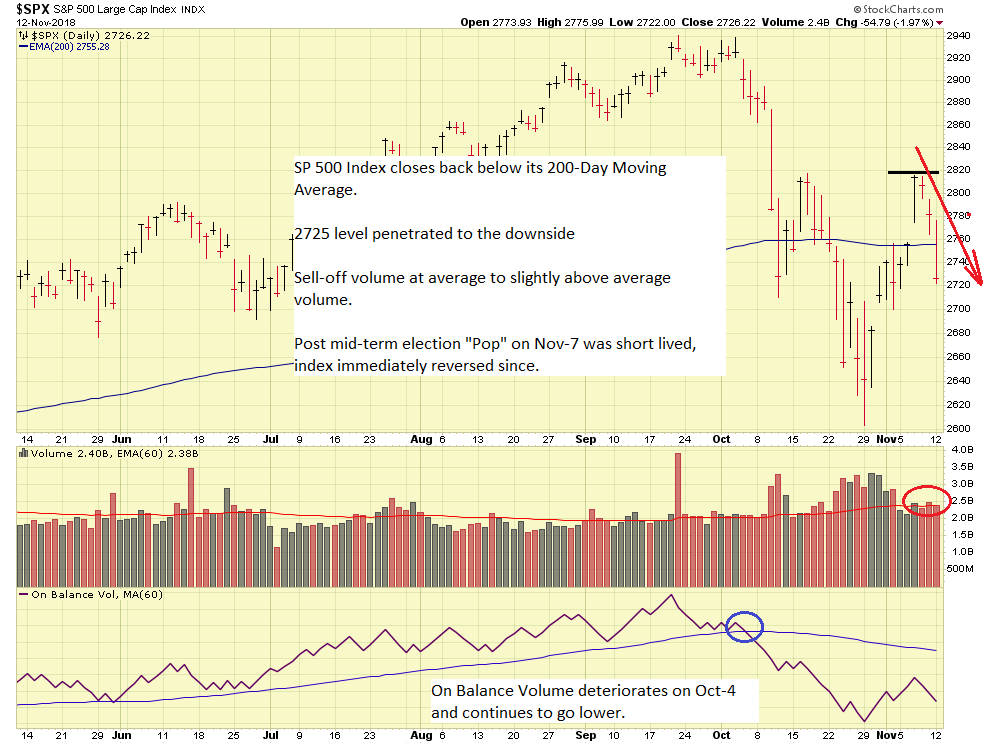
I got a few emails and messages from some who wanted to “jump back in” to stocks/stock funds when they saw the Dow Jones rally 545 points on November 7, the day after mid-term elections.  The general mantra was “we are missing some gains.”  However as it turned out, those “gains” quickly evaporated when the mid-term “pop” capitulated and reversed lower.  On more than one occasion, I had to use a soft voice and soothe some skeptics, who believed stocks were going to triple the next day.  The purported rally was viewed with suspicion by me, due to its lack of volume.  It appears my crystal ball was accurate:  Using closing data, the Dow Jones index is 793 points lower today compared to the Nov-7 close.  Not exactly the “missed gains” some believed would happen.

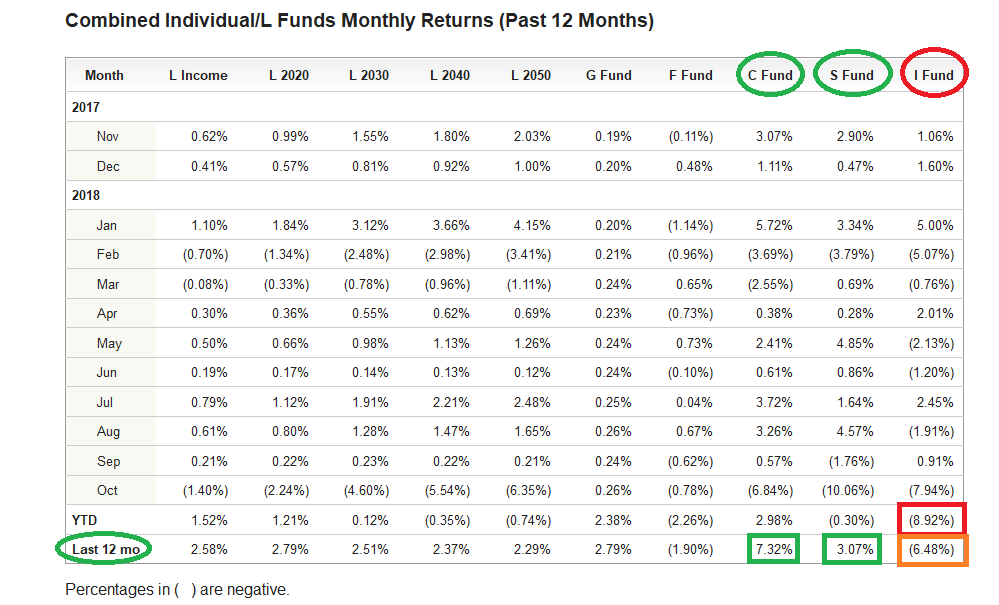
Before I go farther, lets talk about recent TSP Fund Performance.   October was brutal, however a look at the chart will reflect that last 12-Month performance had the best gains in the S-Fund and C-Fund, two funds out of ten choices, that I have personally been in myself almost all year.   The I-Fund performance was/is the worst fund Year to Date and last 12-months.

A review of various financial and investing websites (to include TSP sites) seems to theorize that this “downtrend” is merely a “hiccup” or “speed bump” and things are “not unlike a similar selloff in February.”    However things indeed are different.    The following facts were either not known/not on the horizon, back in February:

  • Housing cooling off
  • Interest Rate Hikes further along then February
  • Corporate Earnings from numerous companies below expectations
  • Tariff disagreement and threats of sanctions/counter-sanctions
  • 30-year Fixed Rate mortgage rate presently at 7 year highs
  • Numerous indicators reflecting a slowing economy

As such, in my opinion this downtrend is a new situation and possibly reflects a looming Bear market ahead.  I mentioned in my Oct-23 post that:

“…things may rally back up in the coming weeks, but the “smart money” will sell into this rally (if it occurs…), capturing some last-minute gains, but then, soon after, the bottom may fall out of the markets. A technical indicator, the 50-Day and 200-Day moving average, indeed reflects a possible downturn ahead…”

I still hold that belief, especially if agreement with China does not occur at the G-20 Summit, which begins Nov-30 (17 days away).  Further compounding problems is a very probable rate hike by the FOMC in December.   My crystal ball anticipates additional turbulence in the months ahead.  Lets take a look at a chart of the SP 500:

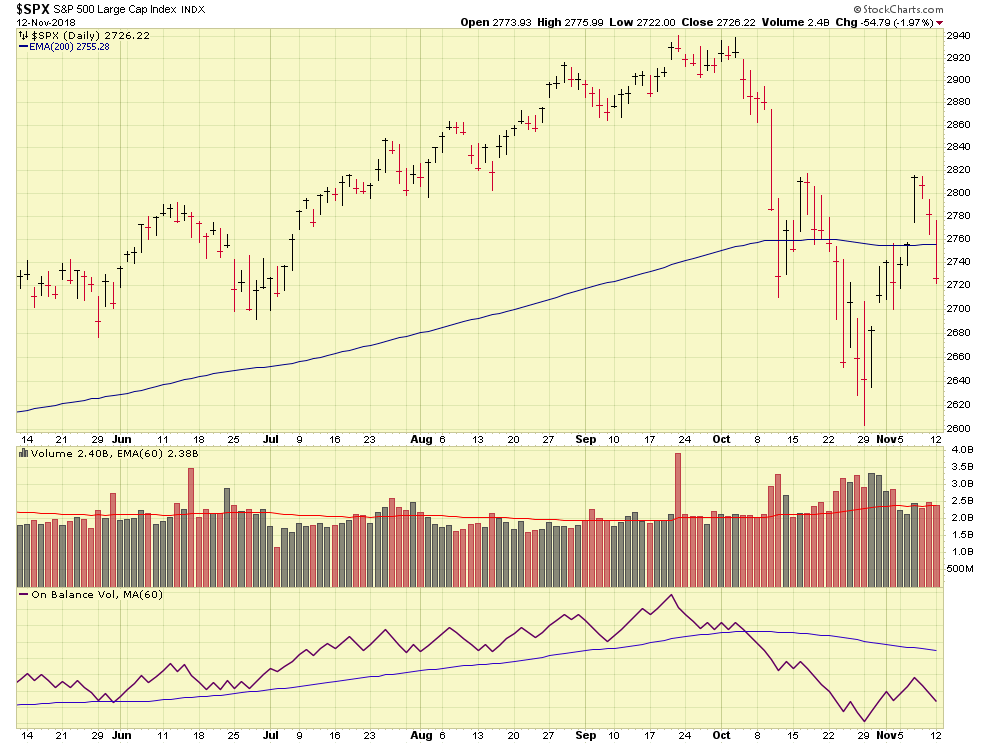
Apparent in the chart is the fact that the Nov-7 “pop” failed, with the reversal of trend on volume which is average to slightly above average.  The index is back below its 200-Day Moving Average, a negative indication.

In light of recent market behavior, and the previously discussed economic signals in the “background”, I remain 100% G-Fund in my personal TSP.

FYI that Core CPI will be released on Nov-14, this may serve as additional catalyst to send markets lower, if the number is 2.3% or higher.

Thank you for reading….talk to you soon….

-Bill Pritchard


Markets try to rebound but volume Weak


Good Evening

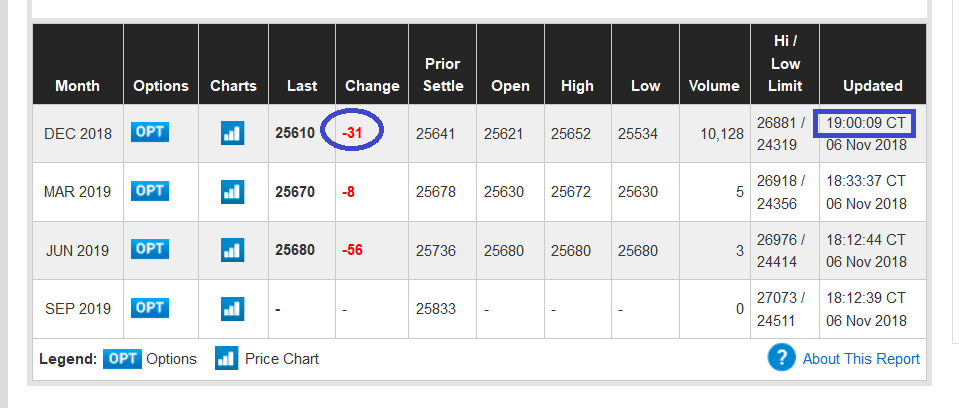
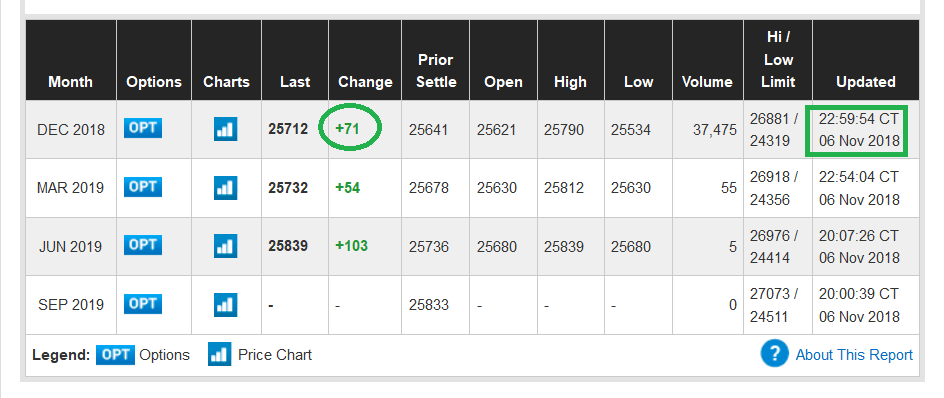
As most know, Nov-6 was the date of the Midterm Elections (unless you voted early).   I have said in prior posts that the midterm elections is one of many trigger events causing stock market angst.   My opinion is any power shift in Congress could potentially derail Pro-business efforts and pro-business tax policy.   As of 11 PM Central Time, it appears that Democrats will take control of the House, and Republicans will have control of the Senate.   The Dow Futures have responded positively to this, see table at 7PM and 11 PM:

Some studies exist that in cases with a Democratic House, and a Republican Senate, this is “good” for the markets but these prior cases are arguably (in my opinion) from a different era of politics, pre-Twitter, etc.  I will not expand further but safe to say I believe the midterms are a point of concern for the markets.  California Democrat Maxine Waters, an vocal critic of President Trump, is expected to become Chairwoman of the United States House Committee on Financial Services, which oversees the banking, securities, and other industries, to include the FOMC, which sets interest rates.  Expect attempts to slow down rate hikes to be met with resistance by the new Chair.

Not until multiple days, post-election, will the “mood” of the markets be identified regarding the election.  It is not known who is getting fired, subpoenaed, or what new investigations will be opened (and on whom) regarding the shift in Congress.  Expect continued discussion of sanctions and tariffs against a variety of countries.  Opinion:  I would “monitor things” before making a decision on a new TSP Allocations.

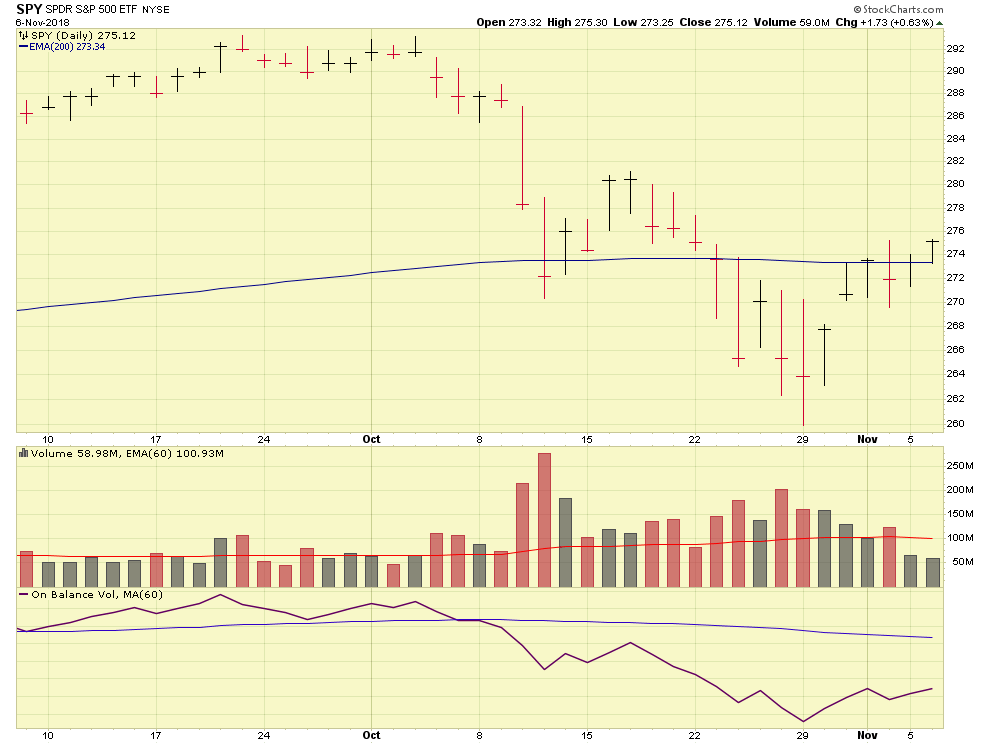
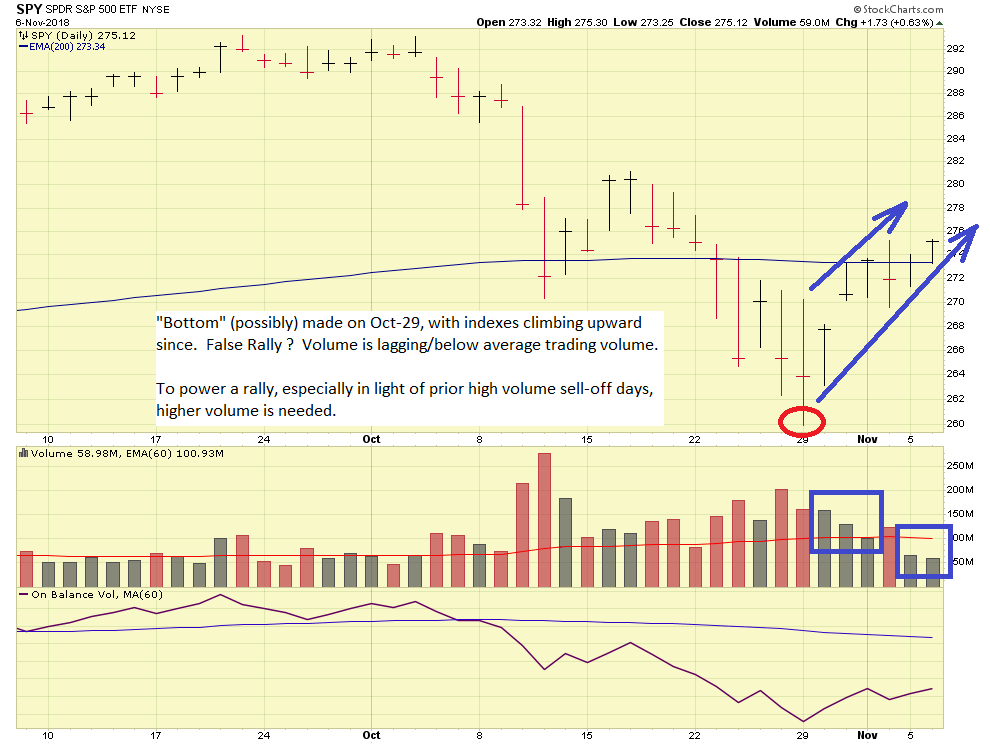
Lets take a look at what has happened in recent days.   The markets are in what is termed “Attempted Rally Mode”, in which they indeed have “up” days however volume is lagging, or below, the 60 to 90-Day average volume.  To overcome prior sell-offs which occurred in October, the markets will need much more powerful volume.  The markets have displayed six “rally attempts” so far.  Ideally, a “follow thru day” occurs in the very near future, with volume greater than the prior day, with the index closing 1.7% or higher than the prior day.   Without a “follow thru day” soon, the market will likely resume a downward direction.

Lets take a look at the SPY Exchange Traded Fund (ETF) as a proxy for the SP 500.

Some important economic reports will be released in coming weeks, CPI Inflation Data will be released on Nov-14, any Core CPI level 2.3% or higher will trigger renewed inflation fears and add fodder to the justification for interest rate hikes.  Anything below would likely be embraced by the markets.   Additionally, the FOMC will release an announcement on Nov-8 regarding current and future monetary policy.

In sum:  I view the recent action with suspicion, due to the lack of volume.  Numerous threats still exist in the landscape, notably a political power shift, interest rate hikes, and threats of tariffs and sanctions.  With that said, I remain 100% G-Fund in my personal TSP Allocation.

Talk to you soon…..

-Bill Pritchard


October finally closes Out


Good Evening

Thankfully, October 2018 is now behind us.  A month that historically is a good month, closed in the red, with the SP 500 having its worst monthly loss in seven years, all in a month that should be up.  TSP Fund Returns reflect that all funds, except the G-Fund, closed in the red.  On a 12-month basis, the only negative fund was the I-Fund.  On a Year to Date (YTD) basis, the worst performer was the I-Fund.

My opinion is the market continues to be challenged, primarily by the below things:

  1. A possible cooling economy.  “Cooling” can be painted as a super white hot charcoal briquette turning into merely a hot briquette.   Both will burn your hand.  The overall economy is still churning along pretty well.  But numerous signals reflect things may be cooling.
  2. Interest Rate hikes in December.  Most believe the FOMC “has no choice now” but to demonstrate independence and freedom from political influence and thus raise rates in December.
  3. Midterm election uncertainty.  Midterm elections are November 6, any sway of power from one party to another could be a destabilizing event and put at risk the other party’s initiatives, many of which are Pro-business (US business…) in nature.
  4. Unresolved Tariff Situation.  With the G-20 summit scheduled for Nov 30-Dec 1, a lot of hope exists that progress can be made with China regarding tariffs.  But the “proof is in the pudding”, we have seen no movement on this issue yet and tariffs are still expected.
  5. Poor Corporate Earnings / Poor outlook ahead.  Numerous companies have reported poor quarterly earnings and/or poor outlook ahead.  Included in this list are well-run and large, dominant players- GE, Kraft-Heinz, Ford Motor Company, 3M, Disney, 

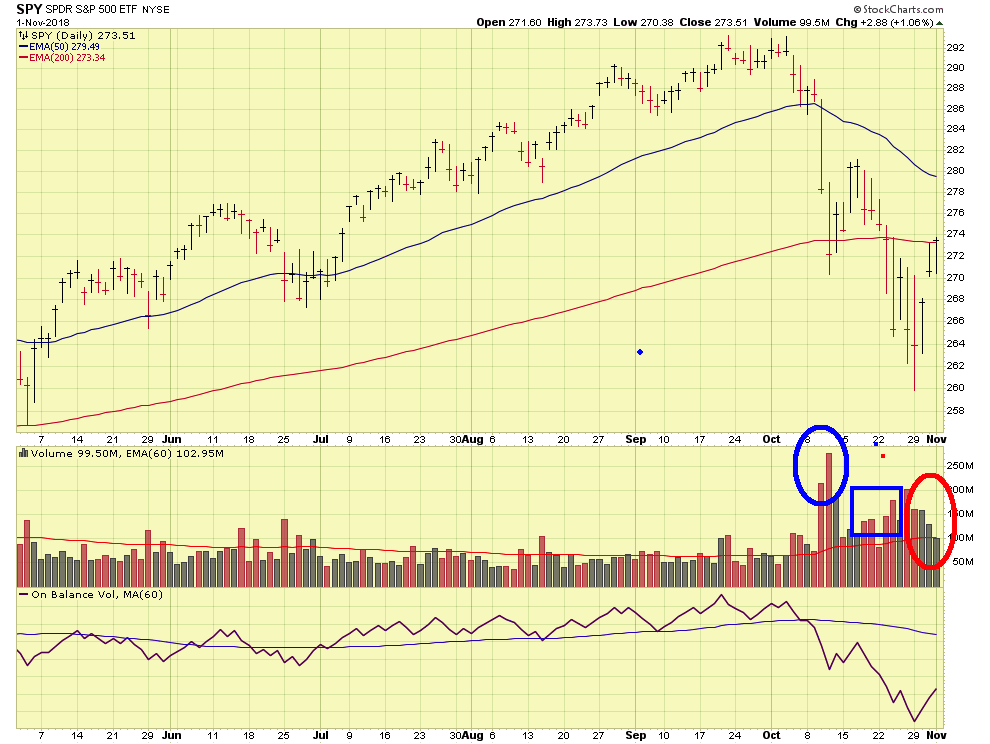
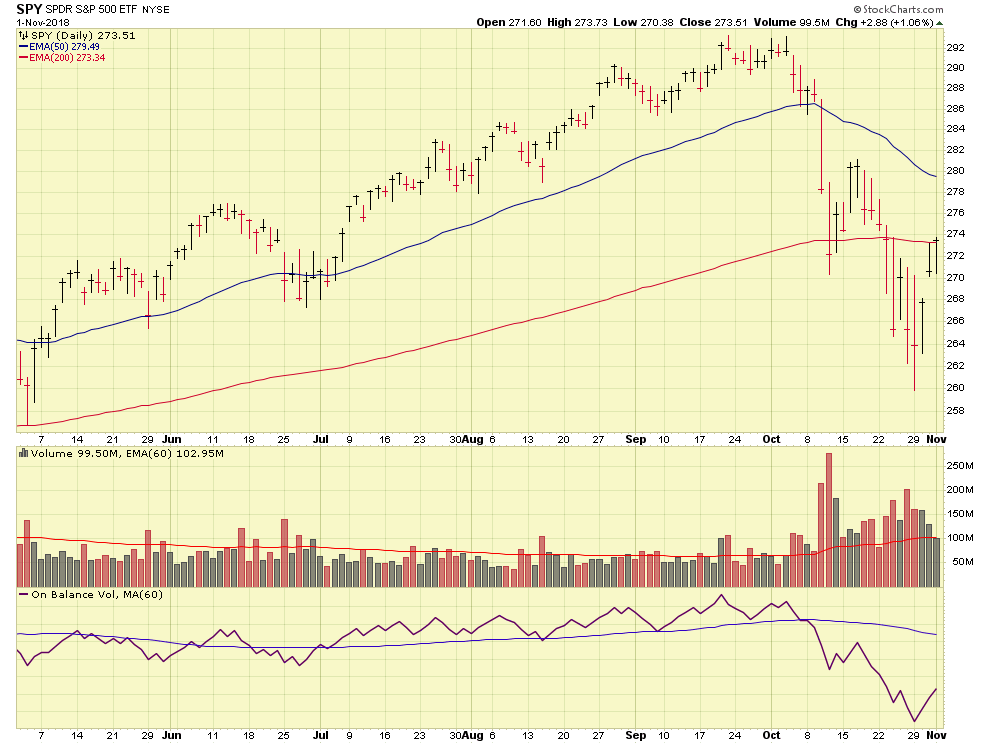
I got a couple of messages from folks regarding this week’s action.  Indeed, the markets rallied.  We are in a tug of war, bulls versus bears, and my status in G-Fund means I am watching the boxing ring, but not in the ring.  Note that a close analysis of the SPY Exchange Traded Fund (ETF), reflects lesser volume each day of the “rally”.   See chart:

In blue, you will see the “sell off” volume growing larger each day, indicating that more folks hit the fire exits each day, versus less.   Then it appeared to have possibly reversed this week (Oct 29 week).   The buying volume trailed each day.  It did not pick up each day, indicating that as time went on, the “number of believers” were less and less.  To reverse the prior damage, volume needs to pick up (ideally exceeding each prior “up” day), and prices need to go higher.   The SP 500 Index is sitting at the 200 Day Moving Average, a widely accepted “caution zone”- anything above is good, anything below is bad.

With that said, my opinion is the markets are indeed in a correction and I prefer to be investing in the G-Fund.   Yes, investing, the TSP site itself labels it as such, the word invest or investment is mentioned seven times on the TSP G-Fund page:    https://www.tsp.gov/InvestmentFunds/FundOptions/fundPerformance_G.html

The TSP site (a site with good information) says this about folks nearing retirement:  https://www.tsp.gov/PlanningTools/RetirementPlanningPhases/nearingRetirement.html

The way in which you distribute your money among the TSP funds should reflect your time horizon and your risk tolerance. The closer you are to retirement, the shorter your time horizon. As a result, your primary focus might shift from growth and accumulation to safety and preservation. Even if your risk tolerance is very high, you may not have time to recover from severe drops in the market if a large portion of your account is allocated to stock funds. If you determine that you have not saved enough, this is not the time to take on more risk than you have the ability to sustain — the better alternative would be to increase your savings.

[Written to target pending retirees…] If you are heavily invested in the stock funds, now is the time to consider shifting to a more conservative allocation, especially if you do not have other retirement funds safely invested elsewhere.

Just wanted to share that for awareness.

Thank you for reading….I remain 100% G-Fund in my personal TSP.

-Bill Pritchard


Market Action on Oct-25 Unimpressive


Good Evening
Just a short note, but in my opinion (everything on this site is all my opinion..) the market action on Thursday Oct-25 was “unimpressive.”  I say this because most of the media was busy high-fiving each other and proclaiming that “the bottom was made” (in one day…) and “things are rebounding.”   What they missed was that the high on the indexes did not exceed the prior day’s high.   Had it done so (which it did not), I would have a different opinion.   See chart:

Until the SP-500 is able to exceed 2745, a nice round number based off the Oct-24 high of 2742.59, my bearish stance will not change.  By definition, a new uptrend must exceed a recent prior high, ideally on healthy volume, and with a “backdrop” of strong/improving fundamentals and positive/improving economic conditions.   The current backdrop includes a cooling housing sector, some fairly big (and arguably well-run) corporations missing earnings (to include Amazon and Google), and some other flames appearing in the windows, indicating that things may turn to ashes soon.

GDP Data will be released on Friday October 26, this is a Catch-22 situation, you can never win with GDP.   A strong GDP is “good news” for the economy, but if anyone has read my posts back in 2014-ish, the recovering economy means the FOMC will raise interest rates, because the economy “can absorb the pain” and higher rates will “tame inflation” (another topic for another day).    A weak GDP is “bad news” because it says things are slowing down, but this may prompt the FOMC to hit the pause button on interest rates.   Long story short, GDP data is coming on Friday October 26 and the market could literally do anything in response.    Most estimate that 3.4 to 3.6% GDP growth will be announced.   President Trump has publicly stated that GDP will be “outstanding.”  The prior GDP was 4.2%.   See graph:

Again, just a quick note to summarize my views of the trading day, the day after the NASDAQ’s worst performance since 2011.   Be cautious when you hear the market is “in a normal correction” (no correction is “normal”, if you catch the Flu every two years it is still not desired…), or that the “jobs reports” are still strong.   Jobs don’t show bad news until companies repeatedly miss earnings, their stocks tank, then layoffs are announced due to “restructuring” and “redefining our business model”.   So jobs are the LAST indicator to use if you are trying to anticipate market downturns.   They indeed are good overall, long-term indicators of the economy.   If full employment exists, then yes, things are good.   Just be careful using unemployment numbers as a bulletproof, error-free, device to forecast the stock market.

Until next posting (when warranted…), thanks for reading and talk to you soon

-Bill Pritchard