
Hello everyone
The markets have rebounded from last week’s dismal performance, which was arguably caused by the tragic events surrounding the Boston Marathon, poor economic news from China, and other factors.
As we know, the suspects in the Boston Marathon incident are either dead or in custody, due to the great work and cooperation between members of the public, and our law enforcement and public safety community. There is no doubt that their quick capture/demise “sends a message” to the world, and as we finish up this week’s trading, the markets have (not surprisingly) rebounded, as uncertainty and questions regarding the Boston incident are now able to be addressed.
Some have emailed me and asked me why I did not panic regarding last week’s downtrend. As most of you know, I use a combination of fundamental and technical analysis, combined with historical “look back” at similar events and situations when I see the market begin to stumble. One of my tools in my “toolbox” is the use of Moving Averages, which in simple terms is a moving trend line which responds to the price activity of a stock or index. A very popular Moving Average is called the “50 day Moving Average“, and my backtesting and research reflects that as long as a stock or index closes (not intra-day price behavior but closing price) at or above this line, then the trend is likely to remain intact. Multiple closes below this line is a warning sign (coupled with other data and information prior to pulling the sell trigger). My use of Moving Averages was documented in an article written by me, published in the January 2006 issue of Technical Analysis of Stocks and Commodities Magazine, which is sold nationwide at Barnes and Noble.
Lets take a look at the CLOSE ONLY price performance of the SP 500 last week. See charts attached. First chart is normal price chart, showing high, low, and close, second chart is close only with no comments, second is with comments.
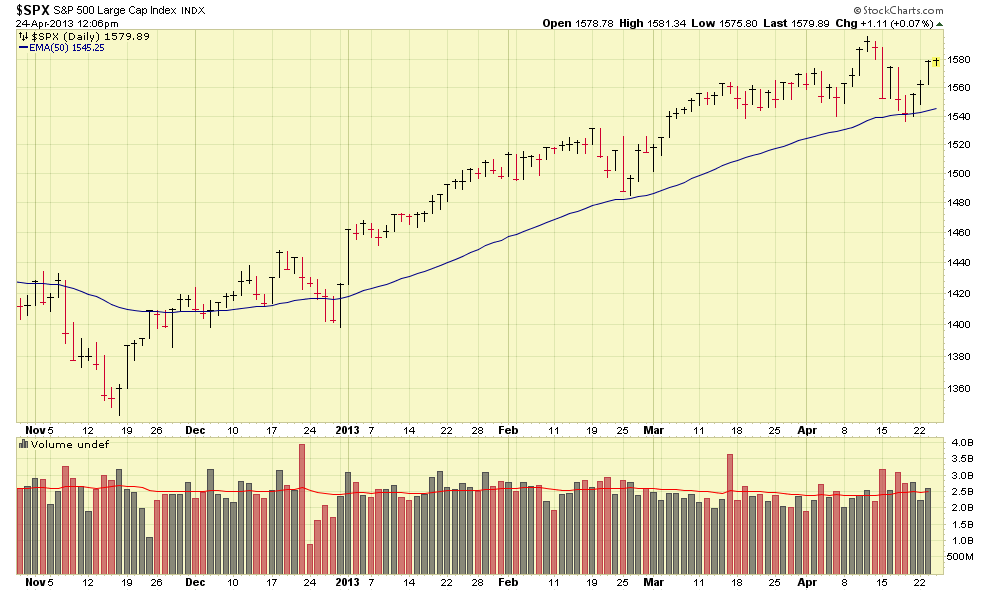
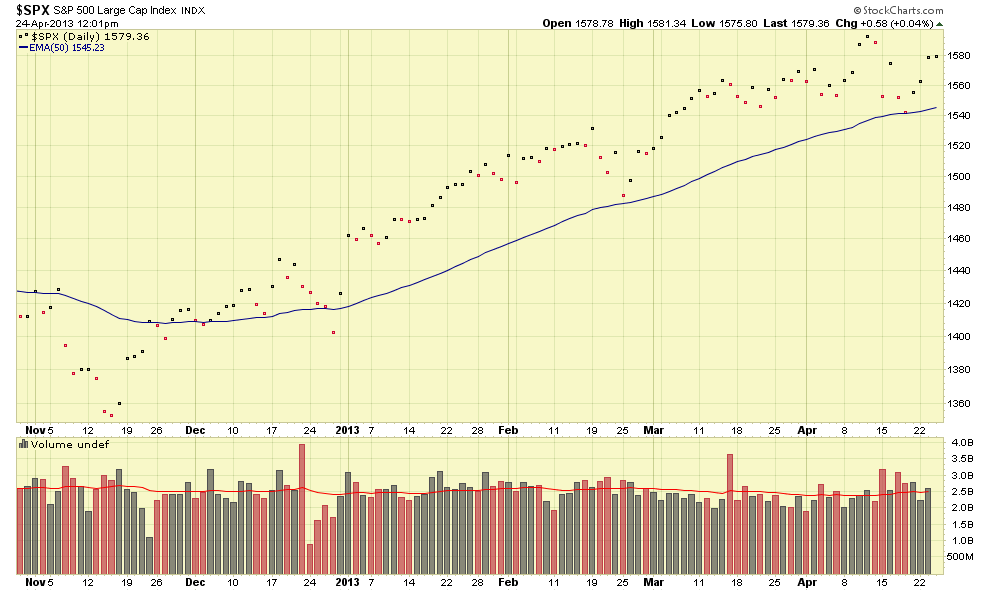
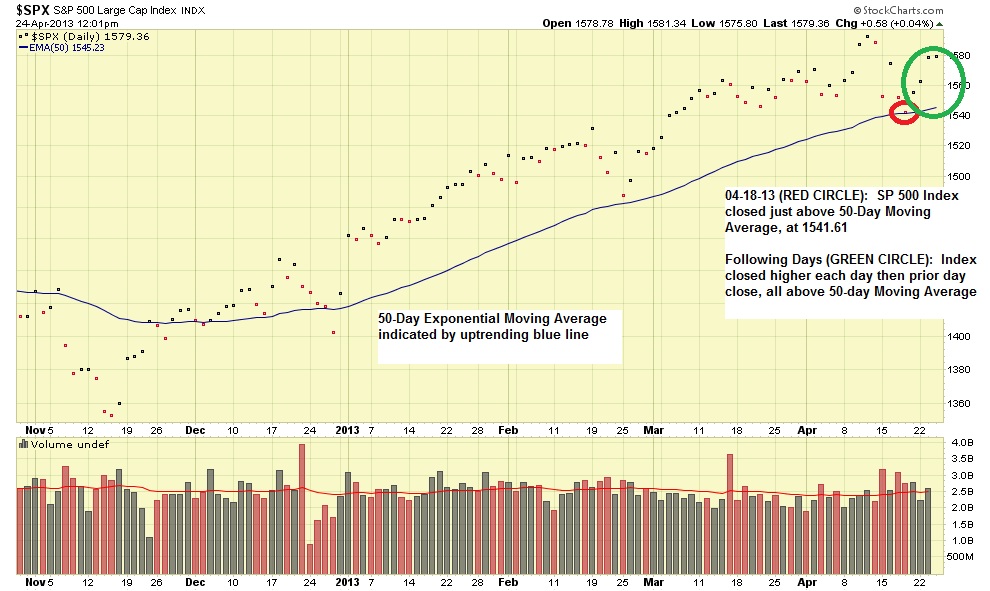
As we can see via the above charts, the same information becomes more clearer depending on how it is viewed. Time allowing, I like to use “close only” charts when we hit speed bumps in the road, and by combining this with other data and information, I am typically able to make a decision and rest better knowing the decision was made with all available information.
On April 13, 2013, I posted some commentary regarding the Boston Marathon bombing and how the market may respond. In support of that post, I went back to some historical events, to include the 9-11-2001 attacks. The markets at that time (let’s remember, behind the markets are people and emotion) responded initially with a downtrend, then rebounded strongly and went up. So my crystal-ball (which rarely works but I still keep it on my desk….) told me that unless human beings got reinvented and the new 2013 versions of humans on Wall Street did not have fear, greed, panic, hope, etc running through their veins, then the market response to Boston would probably be similar.
It turns out that my crystal ball decided to work, as a look at chart one above, shows an apparent “U turn” or reversal to the downtrend and an apparent resumption of the uptrend. Time will only tell if this uptrend continues. We are seeing some resistance in the 1575-1585 area. Most will remember that 1576 is the prior all time high, dating back to 2007 (already penetrated), and is still recent enough to be a significant area, and any close above 1576 is a positive. 1597 is the newest recent high, achieved on April 11 2013. Anything above that represents new territory and further confirmation of the uptrend.
On 04-25-13, the SP 500 climbed thru the 1575-1585 resistance area and was able to hit 1592 intra-day, before closing at 1585. So we are seeing some definite attempts to get up to new high territory.
If all that sounds like Greek, in summary, any SP 500 price action above 1576 is good news, and as of now, the the next goal is price action above 1597. Anything below 1570 is indicative of sickly performance and this will require close monitoring of the index.
I continue to advocate to use the SP 500 Index as a “big picture” view of the markets. Some have emailed me, asking why I don’t use NASDAQ or the Dow. The NASDAQ is susceptible to being driven lower by major NASDAQ members such as Apple (AAPL), which has suffered some setbacks to its stock performance in the last few months. However just because AAPL is going down, does not mean that the entire stock market is going down. The SP 500 is 500 stocks and in my opinion offers a better assessment of market health.
With that said, I am still 100% S-Fund, as it appears that the S-Fund will perform best this month (or “least worst” given the various market issues this month).
Thank you for reading. As always, if you find this site useful or informative, please forward this to your friends and coworkers and encourage them to sign up for free email updates. Thank You
– Bill Pritchard
