Feb 25, 2014 Update / Return to S-Fund

Hello Folks

Thank you for the numerous emails and inquiries if I was alive.  I am indeed alive, however I was on a recent 6-week TDY detail and mostly out of touch.  I am still trying to recover, and am using music therapy to stay awake and post this…

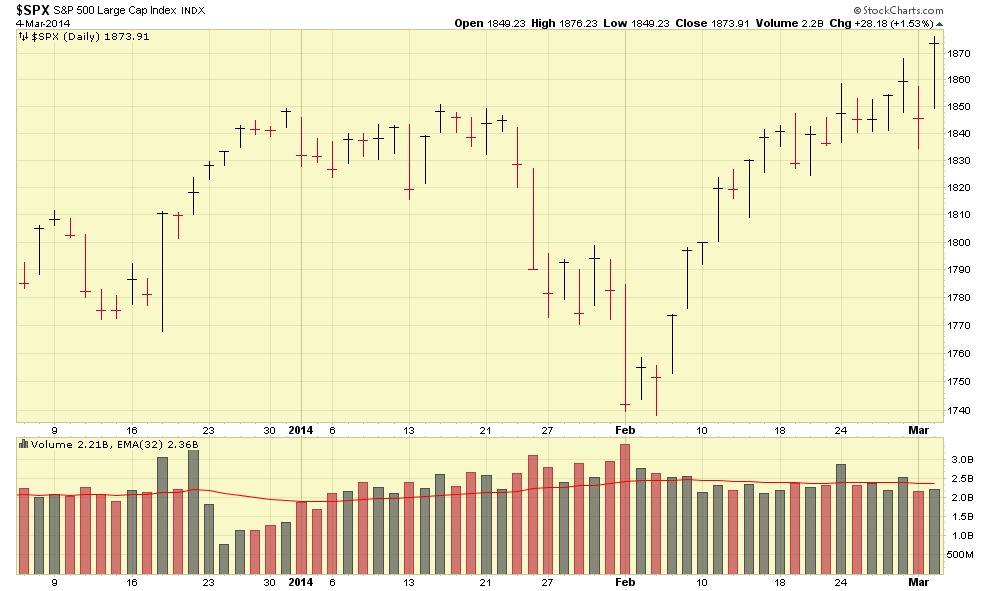
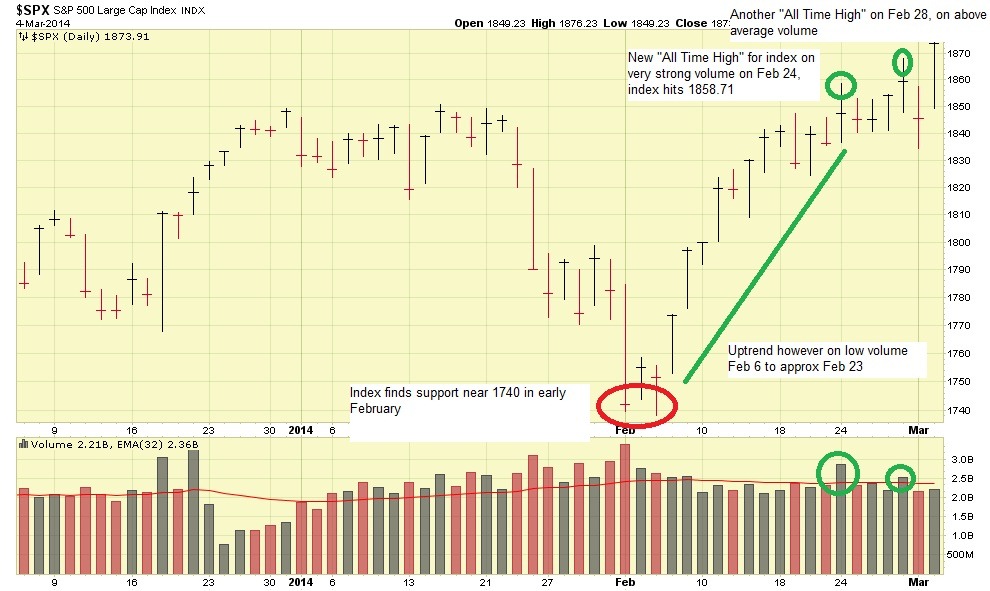
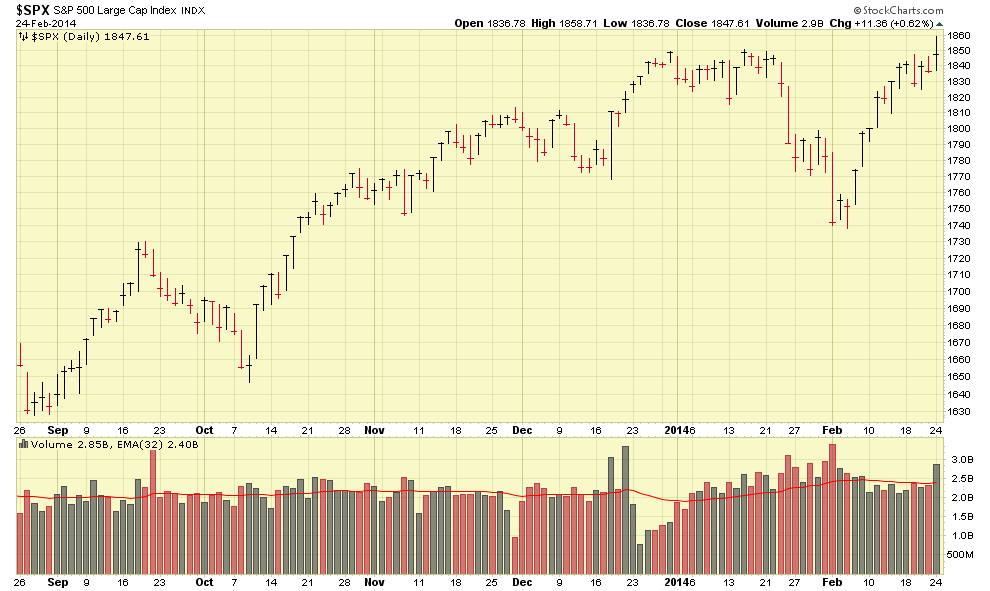
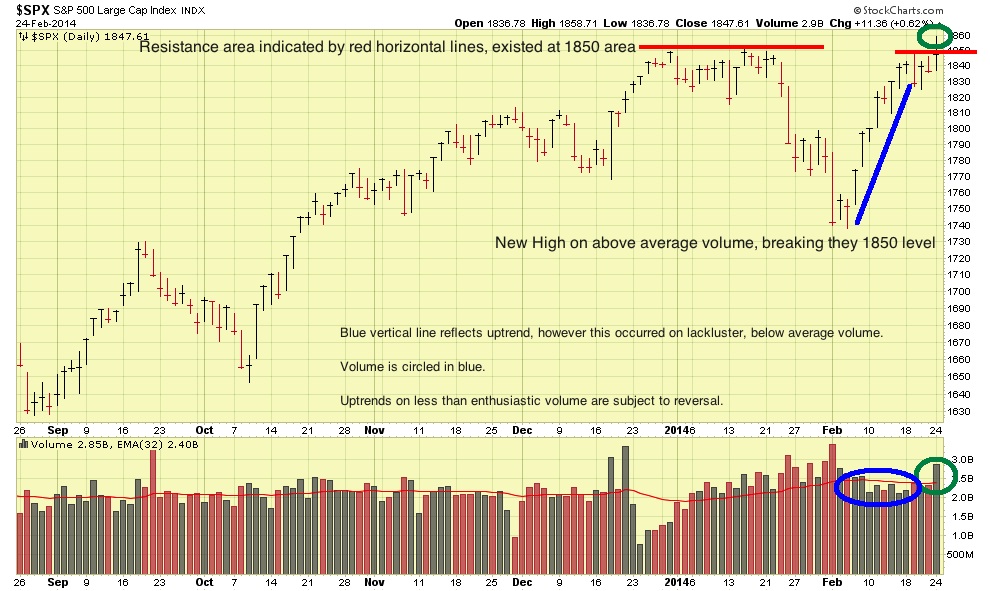
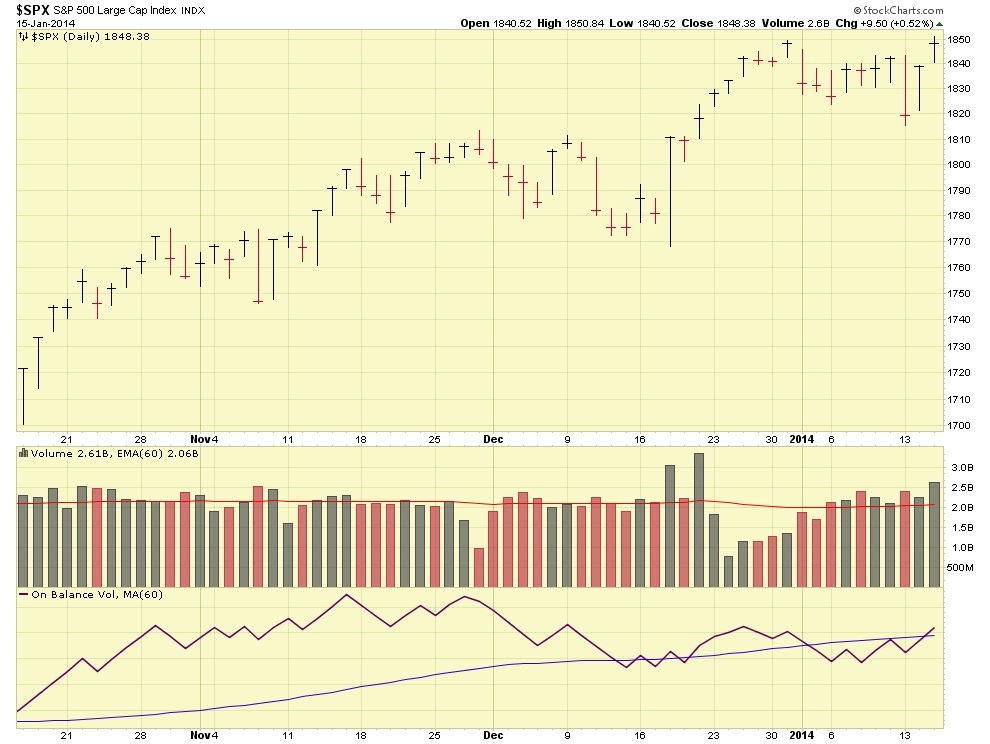
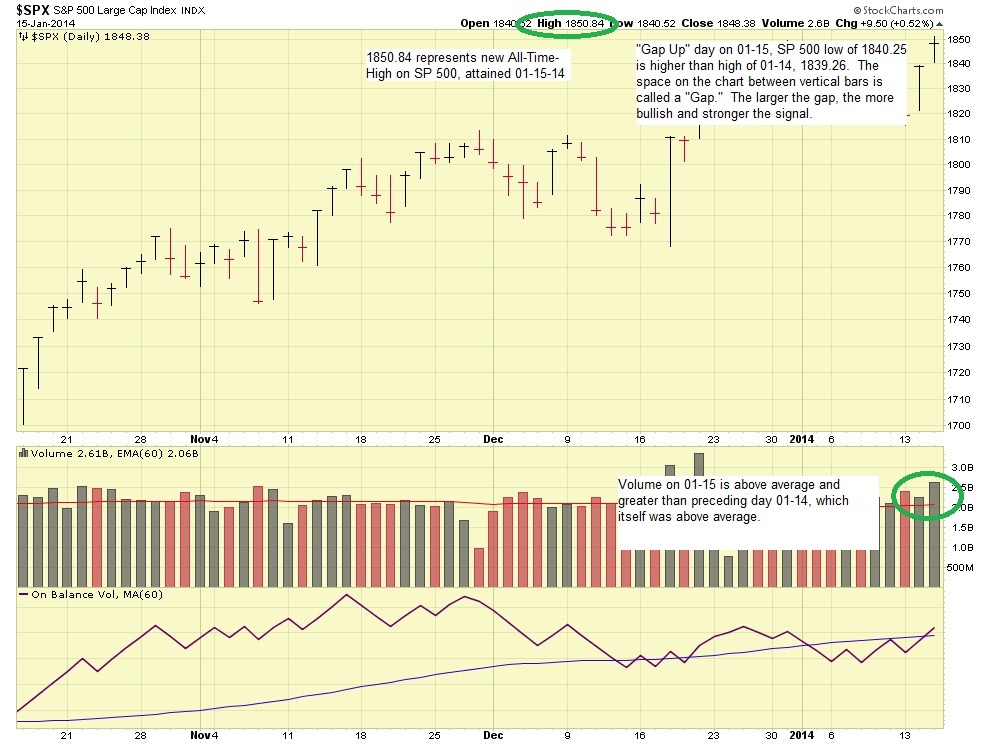
With that said, I am returning to 100% S-Fund.   The SP 500 index in February ticked upward, indeed, however this was on less than average volume.  That type of volume aka “less than enthusiastic volume” is reflective of an uptrend which can collapse and reverse.   Remember, volume is the “horsepower” behind the move.   Today, Feb-24, the SP 500 reached 1858.71, a new All-Time-High (ATH), on above average volume.   Readers may recall via past postings that I am very fond of the All-Time-High and above average volume, as this is a solid indicator.

Lets take a look at some charts, first with no comments, second with comments:

SP500-02-24 SP500-02-24-comments

As you can see, the 1850 level represented overhead resistance and a barrier to continued progress, however today, the market (not me, or other “experts”) itself decided that it indeed was in a new uptrend and powered thru the 1850 level on above average volume.   This is when opinion, theory, emotion, etc should be set aside and the investor respond to the market itself.

Thank you for reading everybody, talk to you soon.  Please share this post and my website with your colleagues and coworkers, and tell them I am back from TDY and still alive….

– Bill Pritchard


Feb-3 Market Analysis / SP 500 forming bearish pattern

Hello folks

The last week of January is over, and the month was down, instead of up, in large part to the sell off which started in the last two weeks of January.   The first trading day of February, Feb 3, is over, and it was not pretty, with the markets closing hard down and the Dow Jones Index loosing over 300 points by end of day.  All indexes and sectors got creamed, large cap, small cap, international, nothing was immune.

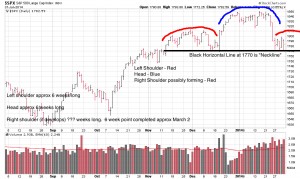
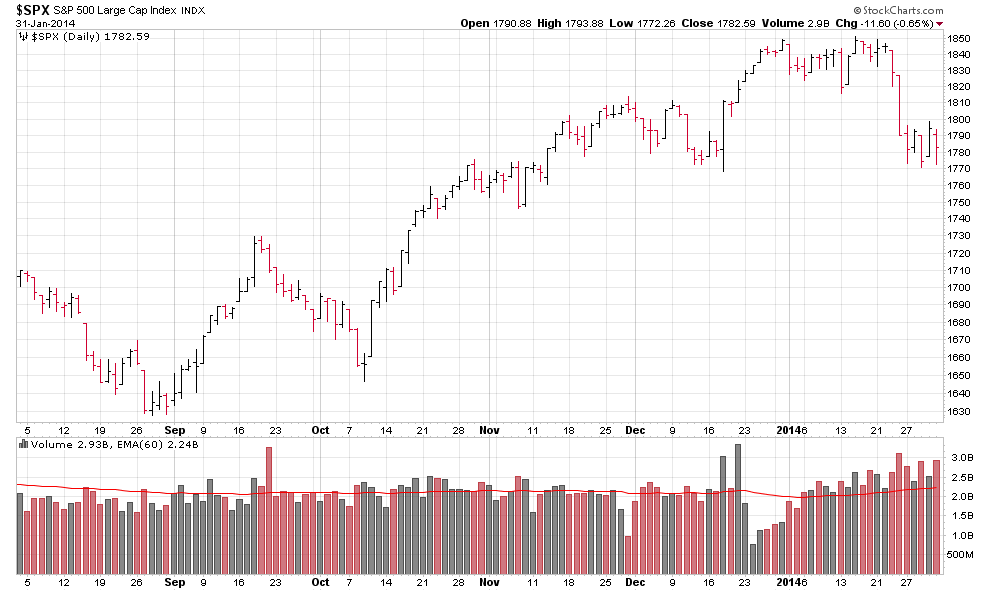
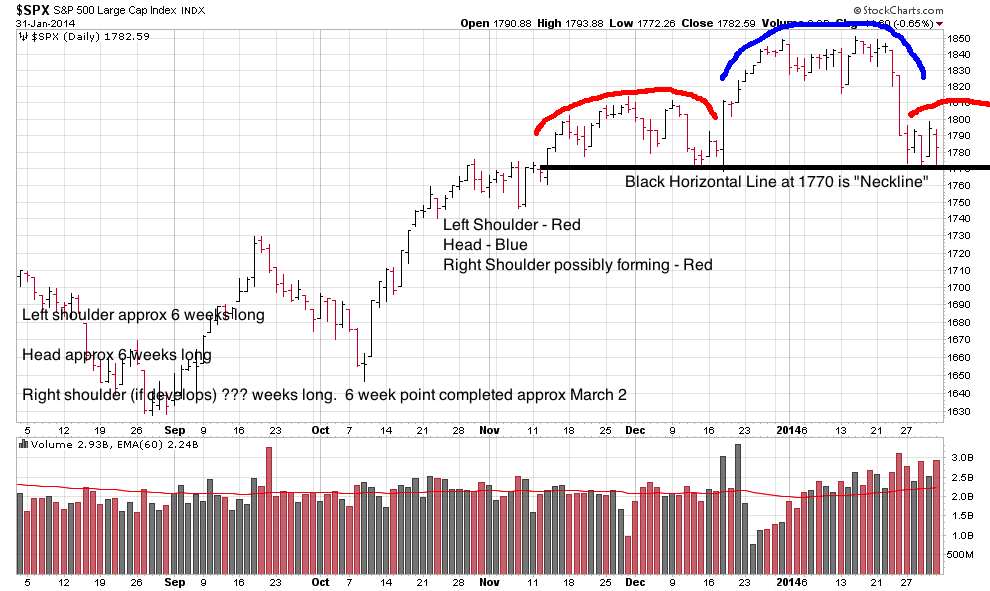
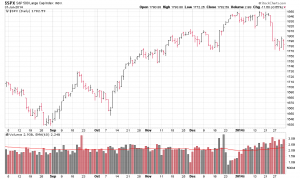
With the month of January now behind us, I am able to review the behavior of the SP 500 index (my “go to” index for assessing market behavior) and I have observed a possible Head and Shoulders Pattern developing.  This pattern, if it occurs within the structure of a topping bull market, can be a very reliable indicator of a pending trend reversal.   While no hard, set-in-stone, rules exist defining this pattern, it is generally accepted to be composed of a left shoulder, a head, and a right shoulder, with all of the above sitting on a “neckline.”   The neckline currently is 1770 on the SP 500.   NOTE:  Due to evening data issues, charts on this update do not account for today’s action (it does not make a difference, today was down, not up).  A picture-perfect head and shoulders pattern (H/S) should be 5 (five) months or longer in length, from left shoulder, thru the head, to the right shoulder, and the left shoulder and right shoulder typically, but not always, similar in size.    Let’s take a look, see images and comments on the images:
SP-500-HS

Same image, with comments:

SP-500-HS-comments

As can be seen, this pattern (which is not complete, the right shoulder is yet to be fully developed yet, we are too early in my opinion….) began to form on/about Nov 11, 2013.   The 5 (five) month completion point will occur on/about April 11, 2014.  Dates are approximate and as stated above, no hard rules exist for these patterns, because behind the pattern, is human behavior, which causes the pattern.    With that said, the current left shoulder is six weeks long, the head is six weeks long, and the right shoulder began approx Jan 27, 2014.  Again, the sizes do not have to be identical.  The volume on this possible H/S pattern on does not meet the picture-perfect H/S volume criteria, likely due to some holidays in each of the last three months and reduced trading activity.

After the formation of the right shoulder, the “neckline” then gets violated to the downside (current still-being-formed neckline of 1770 was broken today Feb 3).  Typically the market will rally back up to the neckline, and break down again, usually on huge volume, thus commencing a new downtrend and bear market.  “False rallies” back up to the neckline will catch the uninformed and unwary, who blindly return to stocks, because the market “is coming back”, not knowing of the bloodbath lurking around the corner.

If this pattern continues to develop into a correctly formed H/S, we will see flatness and lack of uptrend for the next few weeks, and then a break downward, thus commencing a new downtrend.  I am personally 100% in G-Fund, and captured the gains of Jan 30, 2014 on my way out the door, due to the two-day processing time for TSP change requests.  My opinion is, I don’t know if I would be remaining in stock investments “just a little longer” in order to “see what happens”.  Or “I am already down, might as well stay where I am at, no sense getting out now.”  Let me put it to you this way, you are on a raid, and in the hallway, you take two rounds to your raid vest.   And all indications are that the bullets are not going to stop coming.  You gonna stay in the hallway, because “you already took two rounds” ?    Didn’t think so.

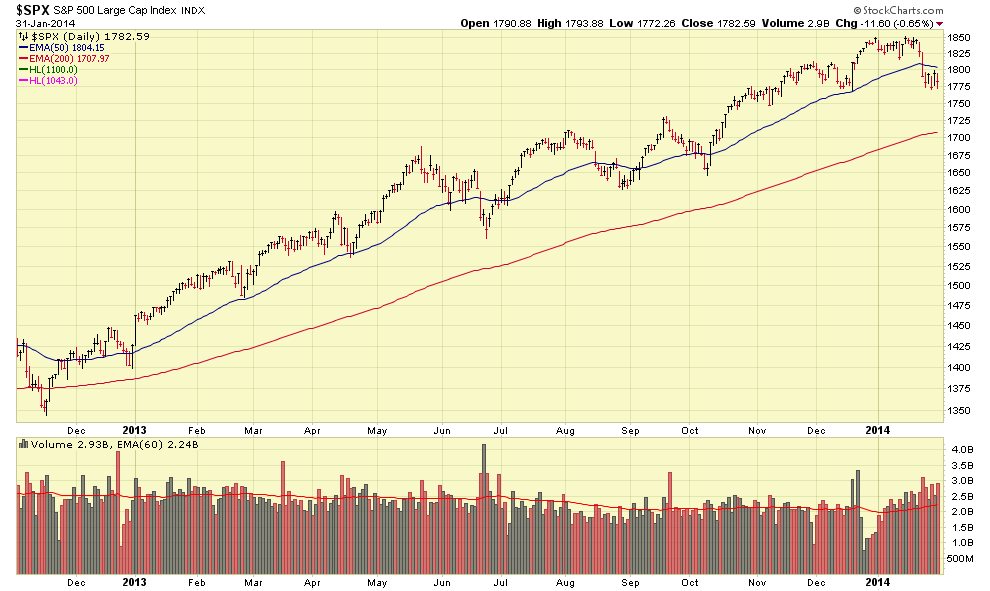
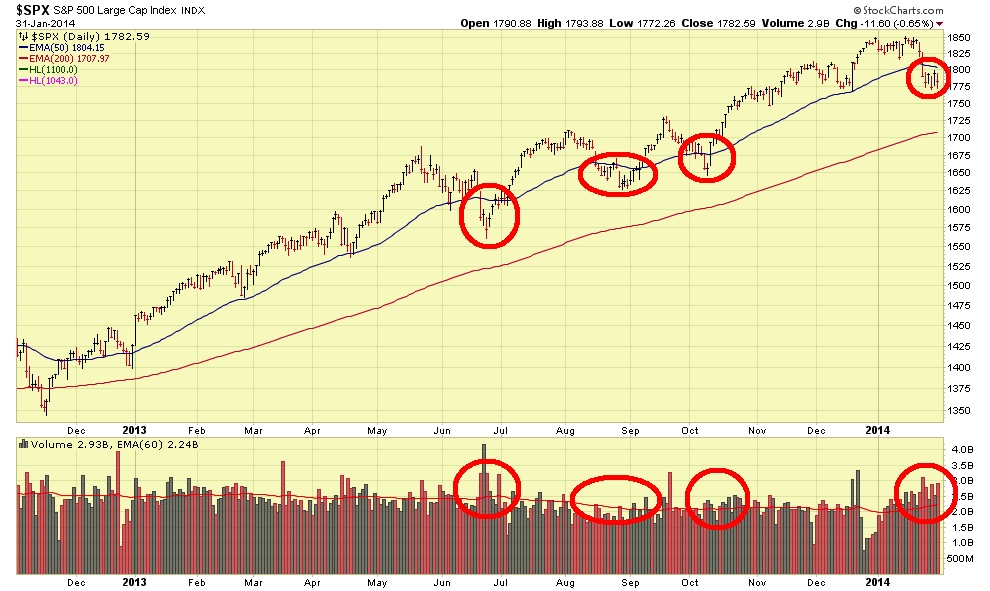
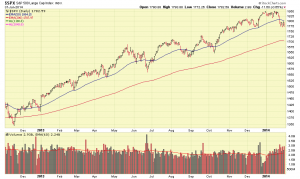
Taking a look at January, it can be seen that the index is still below the 50-day Moving Average, which is a commonly used trend indicator used by technical analysts and money managers.  The index has gone below the 50-day in the past, during June, Aug, and October, but this time the January volume has been much higher than the prior 50-day violations.  Let’s take a look:
SP-500-02-01-14

Red circles indicate points of 50-day violation with attention called to volume on bottom of chart:

SP-500-02-01-14-comments

As can be seen, January’s volume definitely increased and was higher than prior occasions when the 50-day was violated to the downside.   Volume is the “horsepower behind the move”, and any move up or down accompanied by high volume is highly credible.  In other words, if something goes up or down on high volume, then the probability is high that it will continue to go up or down.

Let’s move to another topic, the January Barometer.  As can be expected, some media outlets are bashing this indicator as being unreliable.  I don’t know what to tell you, I mean, you gotta make your own decisions on what or who to believe.  The developers of this indicator publish the Stock Market Almanac, I have purchased their products and dealt with the company, always had a positive experience.  Nobody has a perfect crystal ball obviously, but I am a believer in their products and studies.  Reliable, credible data reflects that the January Barometer is valid to the point that it should at least be a part of your toolbox.   The market itself, is the ultimate signal, but I use some supplementals to assist me and the January Barometer is one of them.   The theory behind the January barometer is that it “sets the tone” for the rest of the year.   Anybody who watched the Super Bowl, probably said “wow, great start Broncos” as this picture unfolded (I know I did…) :

Super Bowl XLVIII - Seattle Seahawks v Denver Broncos

So are we to believe the January Barometer?  You tell me.  Worst January since 2012, and a very bad first day of February, and this behavior (remember, behind market moves, are people…) in the markets is just, not important ?  Means nothing ?   Was the “tone set” for the Broncos from the beginning ?   A fairly basic action (a snap), in the earliest stages of the most important game of the year, bungled ?   How much  did Denver rehearse for this game ?  Denver has been to the Super Bowl before, they know the drill.   Is there any linkage between this being bungled, early in football’s most important game, to their huge loss to Seattle ?   Did Denver “get started on the right foot” Etc ?   Did this fuel or de-fuel Seattle’s already powerful confidence?  In summary, you must form your own opinion on the January Barometer, which for me is a supplemental indicator to the primary signal, the market itself.

Having called everyone’s attention to the prior 50-day Moving Average violations, and my observation that the volume during January’s violation was much higher than on prior occasions, it is important to note that making headlines is the fact that the SP 500 recently had the longest weekly drop since 2012.

In summary, January was a difficult month, and far worse than any month going back to 2012.   The first trading day of February was a disaster.  Let’s see how February shapes up and hope the storm clouds clear up.

Due to my analysis and observations, and opinion that a new downtrend and possible bear market may be underway, all of which was discussed in my Jan 29 2014 posting, my TSP Allocation is 100% G-Fund.   My preliminary review of similar TSP websites (many of which are paid membership sites of $150 or more annually) tells me that The Fed Trader has been the first, and currently, is the only site, which has provided timely forewarning of a possible downtrend.   Folks have to be careful who to trust.  If you can figure out the ownership behind many of these sites, typically associated to PO BOX’s and mysterious LLC’s, good for you.  Here, I sign everything with my name, and if that is not enough, folks have my email and picture, in the event they go bankrupt or their TSP goes to zero based on my market analysis.  Many in the audience know me or know someone who knows me, and can track me down to vent in person.  Here, I believe in transparency and plain, easy to understand analysis, that my audience can relate to.  Advice of the opposite type is common and they even made a movie about it.  Just a heads-up as in the coming weeks, confusion and misinformation will be pumped out by the media outlets, investment websites, and major brokerages.

Talk to everybody soon, and thanks for reading………. – Bill Pritchard

My TSP Allocation is now 100% G-Fund

Good Evening

Despite my personal opinion that the US economy is improving and we are entering healthier financial situations, both at the individual/personal level and also at the corporate, government, and political levels, the market continues to challenge my sanity and ability to sleep at night.    It appears that this is associated to emerging market fears, a downturn in China manufacturing (who manufactures goods for the US), and the QE reduction.   But at the end of the day, I react to the market itself.

Today, it traded lower on increased volume, reflecting yet another Distribution Day within a span of a few weeks.   In addition, the SP 500 has made no progress up towards its 50-day Moving Average, instead closing lower today, than it has any other day during the entire month of January.

Observe that the January Barometer, with two days left, basically has no chance of “going positive” for the month and with a 90% accuracy rate (I am happy to have it inaccurate this year, but….), the crystal ball is forewarning a flat or down year.  Yes, I hope I am wrong.

For the above reasons, I am trying to set my emotions and personal convictions aside and respond objectively to the market itself.  Quite frankly, I confess that I am running out of excuses for the market and the reasons to stay in stock funds are nonexistent.  I have a picture of a duck, and I am turning it on its side, flipping it upside down, looking at it with one eye closed, changing the lighting in the room, and I just can’t make the picture not be a duck.

The market may indeed rally up in a few days or display some up days, but in the grand scheme of things, a possible new downtrend is potentially in the works.   If correct, this will take many weeks to form, then typically break hard down, and continue down for multiple months or longer.  Tonight, I submitted a request to change my TSP Allocation to reflect 100% G-Fund.  Please see FAQ #10 regarding exactly what I do when I make a change to my TSP Allocation.

This allocation change will prevent further account damage and in the event of a severe stock market break downward, those in G-Fund will be protected.    The FAQ on this free site discusses my investing strategy, I have had some new subscribers (thank you for signing up) asking me multiple questions, most of it is answered on the FAQ.

Please be familiar with the disclaimer section and that how your manage your TSP is up to you.   I think everybody “gets it”, so with legalese aside, I am moving to 100% G-Fund.

Thanks guys, talk to you soon…

– Bill Pritchard

Market Analysis and State of the Union Address

Hello everyone

Today’s Jan-28 stock market action resulted in the SP 500 index trading above yesterday’s range, and on (slightly) above average volume.   This is a positive development, and a desired change in the water temperature after multiple days of losses.  It closed above 1790, which is a level that I believe to be important, and closed at 1792.50.   The next level I am watching is 1806, as that is the 50-day Moving Average of the SP 500 index, any close above that, and we can all breathe somewhat easier.  In light of AAPL’s poor performance, the indexes displayed complimentary strength.  Overnight markets in Asia (open while America is closed) are trading positively, which is a good sign.

As most know, tonight was the State of the Union Address, and the discussion was basically about jobs (job creation, training, education) and energy (move automobiles to natural gas versus gasoline and discussed pro-solar energy stance).   My December 10 post discussed the importance of jobs, under Point #4Clearly the President’s economic team has advised him of the importance of jobs, and this announcement is not a surprise to me, as we also have the QE reduction in effect, and the FOMC meeting which concludes tomorrow, Wednesday.   So a few economic policy items are in motion and magically on the first State of the Union address of 2014, we hear about jobs.  No, I am not going to claim that I predicted this announcement regarding the importance of jobs, but you heard it discussed on The Fed Trader before our President mentioned it…

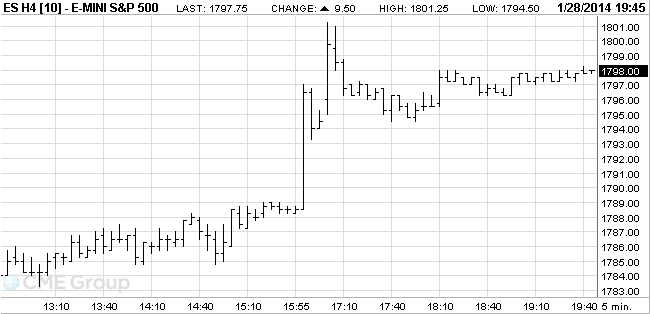
Moving forward, lets take a look at a snapshot of tonight’s intra-day SP 500 futures approximately ten minutes before the President began speaking.   As you can see, they ticked upward leading up to the speech:

SP-500-FUTURES-01-28

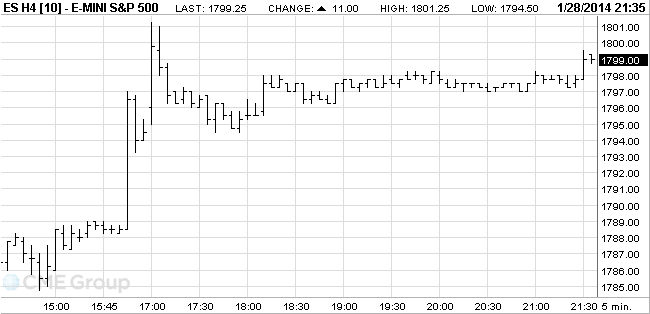
Now, lets take a look at the same chart, at the end of the President’s speech:

SP-500-01-28c

What is clear is that the SP 500 futures went upward, an apparent positive response to the President’s speech.  Evening futures typically act as a preview to the upcoming daytime market trading’s behavior.

Summary:   Today’s stock markets traded up, and could have traded higher had they not been dragged down by AAPL.   State of Union address discussed many things but jobs appeared to be hot topic.   SP 500 futures, trading during evening, displayed positive reaction to the President’s speech.   Evening Asian markets are positive.  “Next goal” for SP 500 is close above 1806.

My TSP Allocation remains 50% S-Fund and 50% C-Fund.

– Bill Pritchard

Jan 28 Update / Monday markets perform poorly

Good Evening

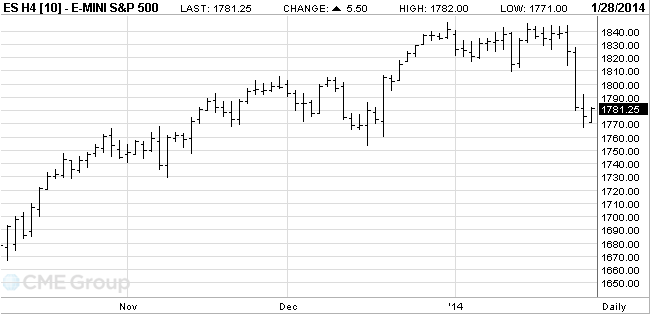
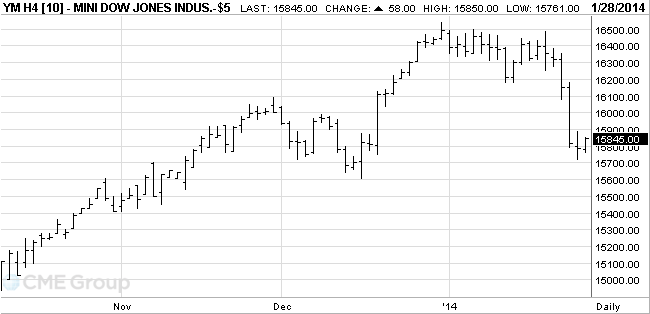
I apologize for the chimes on your Blackberry as you receive this update, late at night, however I felt it was important to send this update out.   Please note, my TSP Allocation has not changed, yet.  With that said, today the SP 500 indeed penetrated downward thru the 1790 level, which was the low of the previous session, reflecting a continued downtrend of price action.   Fortunately, volume was lower than the prior trading day, which serves to temper my concerns, somewhat.  After hours, the Dow Futures and SP 500 futures were trading up, having found support and not trading below the day session’s lows as of 1AM Eastern Time.   See charts:

SP-500-FUTURES DOW-FUTURES
This act of resilience by the indexes provides me with some optimism that the markets will not go down without a fight, and I am not changing my current TSP Allocation (not yet). Observe my prior post, in which I discussed that perceived problems in Argentina and international markets have caused some panic selling by institutional investors.  In addition, it appears China is having some issues, combine this with the FOMC meeting this week, and the unknown statements on Tuesday’s State of the Union address, and it appears the markets are overly nervous.

NOT good, is that Apple Computer stock dropped 8% in after hours trading, due to disappointing sales and revenue outlooks.   This is a huge drop, as Apple is a large-cap stock, and a member of the NASDAQ 100.   You can fully expect that the market action on Jan 28 will be dragged down by AAPL.

No matter what happens this week, it will take a miracle to kick the month into a “positive month” in which we have a positive, and not a negative, percentage return.  With that said, if you subscribe to the January Barometer theory, as I do, the calendar year is not looking good for trading.   That may be reason alone to reduce exposure to stock funds and move partially to the G-Fund, as this is based on documented historical data, not hocus pocus or complicated economic theories.

Next up this week is the FOMC meeting, State of the Union address, and observing how the market absorbs the AAPL news.

My TSP Allocation remains 50% S-Fund and 50% C-Fund.

– Bill Pritchard

Jan 25 Update / Markets down hard due to International concerns

Good Evening

Last week was not pretty in the markets, US indexes and the international indexes witnessed severe losses on above average volume.  This is reflective of institutional selling, which is clearly a “red flag” and reason to moving the trigger finger closer to the G-Fund.   The sell-off in the markets appears to be attributed to financial problems in Argentina, in which inflation rates of over 30%, currency valuation issues, and low currency reserves, have prompted fears for international markets.   The worst performing markets last week were Argentina, France, and Germany.   Not surprisingly, the I-Fund was hit hardest last week, C-Fund next worse (#2 place on the worst list), and S-Fund being hit but escaping with the least damage.

Some fear that Argentina, running out of currency reserves (have we seen this show before?) , may default on current debt obligations, which will impact the lenders and impact credit ratings.  Seeing this, institutional investors likely got nervous and bailed out of other emerging and international markets.   The problems started Thursday, and continued into Friday.

My analysis of this, is that this was “panic selling” akin to when someone yells “Fire” in a movie theater.  Nobody is sticking around to analyze the fire, or how fast it is spreading.   People are just hitting the exits, and will look back once they get outside.   With that said, it is my opinion that institutional money bailed out on Thursday, and on Friday, they continued to hit the exits because they did not want any surprises over the weekend.  They could “rest easy” over the weekend, knowing that they had liquidated positions and were out.   Hopefully, on Monday Jan 27, people will reassess things and decide that Thursday and Friday were overreactions based on fear and not fact.   The following observations prompt me to believe that the US economy is back on track and things structurally are improving, home in the USA.  These are all available via google search, I have assembled some of them here:

1.  2013 home sales numbers higher than any year since 2006

2. Improving labor market evidenced by reduction in jobless claims data

3. Lower foreclosure rates (admittedly this may not mean anything, most foreclosures were related to 5-year ARM mortgages, and the peak of the housing cycle was approximately late 2007, more than 5 years ago.)  In other words, the “real estate boom foreclosure” cycle is behind us, if using the 5-year ARM as a reference point

4. Record new car sales numbers in 2013

5.  Record numbers of airline travelers, and airlines ordering record numbers of new airplanes, and hiring pilots.

6.  Gold prices in a downtrend, which began in late 2012.   “Safe haven” investment of gold loses favor in good economic climates as investors pull their money out of gold seeking better returns elsewhere, typically in stock markets.

7.  Corporate Earnings, Retail Sales data generally improved in 2013 over 2012.  I say generally because one needs to view this with a grain of salt.  “Sears reports poor earnings” or “Kmart has a bad year” does not necessarily mean that Joe Customer is broke / unemployed / bankrupt and therefore not shopping and stimulating things.  He is possibly one of many customers who are spending their dollars via Amazon.Com or at other stores, and saving gas and not having to park the car.  Just FYI when someone tells you that America is doomed because the local K-mart is empty.   Actually, America may be better off without having to step on gum in the parking lot, walking around a spilled Slurpee in the aisle, and old hot dogs spinning on the warmer, and two out of 10 cash registers staffed, all part of the “shopping experience” I have had myself.

Readers will recall my observations that the I-Fund was performing well in January, but I stated that I wanted to give things a little more time before making any decisions regarding the I-Fund, which (over the last few years) is hyper-sensitive to world political problems and economic concerns.   While we are on the subject of January, the January Barometer is not looking good right now.  Some may recall that this indicator predicts how the markets will perform for the rest of the calendar year, with an accuracy rate of 90%.    Lets take a look at the SP 500 Chart so far, from the start of January until present:

JAN-SP500

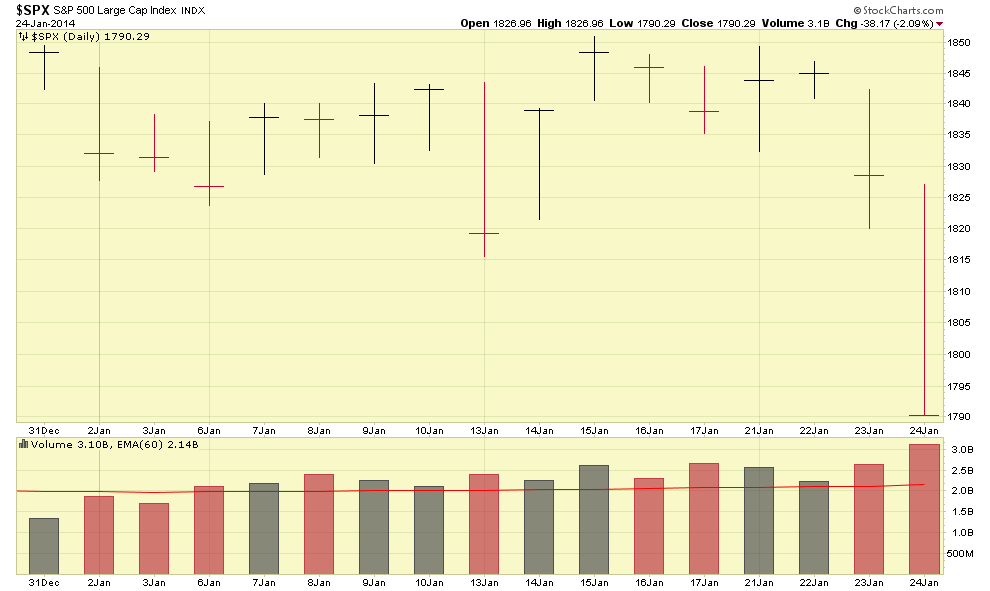
As can be seen, we are currently not “up” in January.   This concerns me, as the January Barometer is a highly accurate predictive indicator for the year to come.  We have five more days of trading left, Jan 27, 28, 29, 30, 31, and January is over, done, El Fin.   We need some miracles this upcoming week because that is what it will take to go from 1790.29 (Jan 24 close), and go above its highest close of 1848.38 (Jan 15), a which means that in one week the SP 500 has to gain 58 points.   Think of this as a football game, and as far as January is concerned, we are in the last quarter.   The markets have to regain some points if the January Barometer is used as a yardstick for the year.  1848 is the key level we are watching, for those CNN/CNBC ticker watchers.   1790 is the key low to watch, anything below that, and a cautionary move to G-Fund is almost obligatory.   Some of the “ride it out, it will come back” fans will surely email me (as they always do) but hey, I know what I am gonna do.   Control the bleeding and seek cover and concealment.

I have no additional charts or graphics this post, I wanted to mostly address what happened Thursday and Friday and provide my analysis.

For now, my TSP Allocation remains 50% S-Fund and 50% C-Fund.
However, I am very close to moving to G-Fund, which I hope does not occur, based on my opinions above regarding the US economy and the reasons the market sold off last week.  Hopefully, calmer minds surface next week and the markets recover.  At the end of the day, the market knows all, and opinion, speculation, theory, do not matter and we must respond to the market itself.    Let’s all be heads up next week as to how things play out.

Thank you for reading….

Bill Pritchard


TSP Allocation for 01-15-14

I apologize.As a follow-up to my post 15 minutes ago, my TSP Allocation remains 50% S-Fund and 50% C-Fund.   BUT 100% S-Fund is fine also, that information should have come out that way in the first message but I hit “publish” too soon.   I need to stop multitasking and trying to send out blackberry PIN messages while I work on this site.

My TSP Allocation:  50% S-Fund and 50% C-Fund.


01-15-14 Update / SP 500 “Gaps Up”

Good evening folks

Today, Jan 15, was a very good day in the markets, as was yesterday Jan 14.   Monday Jan 13 was pretty dismal, with a large sell off on above average volume.  Jan 13 was clearly a “red flag” day and not something we want to see occur often.  As can be expected, many naysayers and market bears came out taking credit for predicting the “coming crash” etc. nonsense, only to have things rebound the next day.   Aforementioned naysayers then disappeared back into the shadows.  The market continues to turn on a dime from one day to the next, so it is helpful to analyze things not only from a daily view, but zoom out to a weekly-monthly-quarterly view, to get a better snapshot of behavior.  For additional understanding of this, take a look at my March 1 2013 post, regarding “report cards.”

Volume on Jan 14 was above average, with the index closing up for the day, then on Jan 15, volume was even greater than Jan 14 volume, with another close up.   This behavior is consistent with institutional money flowing into stocks, such as money managed by mutual fund managers, hedge funds, retirement programs such as the TSP and state employee pension plans.   This is the money that moves markets and “primes the pump” for continued upward action, so it is critical that we monitor volume and price action in the markets.

With that said, on Jan 15, the SP 500 index (my default index for monitoring the health of the market) had a “Gap Up Day” in which the low price of Jan 15, 1840.25, was higher than the high price of the prior Jan 14 trading day, 1839.26.  This causes a “gap” to appear on the price chart.   This is a very bullish signal, and if the fundamental and economic factors are bullish (they are, things are recovering), this in almost all cases is a “buy signal” or at least a huge vote of confidence for bullish market conditions.    See charts below, one without comments, one with comments:

SP-500-01-15-14

SP-500-01-15-14-comments

As a result of the prior two day’s action, my concerns which existed on Jan 13 have subsided to some extent, but not completely.   This is due to the “January Barometer”, a concept developed by Jeffrey Hirsch and discussed in his book The Almanac Investor, of which I have copy (now worn out). The January Barometer, with an accuracy rate of 90%, is an indicator in which every “down January” precedes the rest of the year going down, or flat, for stocks.  An “up January” precedes an up year.   Down or flat is not good, and so far this January has been mostly flat.   We are only two weeks into the month, so lets keep our fingers crossed.   The action on Jan 14 and Jan 15 may be what we need to light the firewood.

Regarding the TSP Funds, the S-Fund and I-Fund are the top performers right now, with the I-Fund outperforming all the other funds (so far) this month.   Before anyone is quick to pull the trigger on fund changes, my opinion is lets allow January to close out and then assess things.  My personal TSP Allocation remains 50% S-Fund and 50% C-Fund.  EDITED on 01-15-14 9PM  

Once again, “thank you” for all the great emails, and please continue to share this site with anyone who will benefit.

Thanks guys

Bill Pritchard

Happy New Year message

Just a quick message to wish everyone a Happy New Year, as in less than 48 hours, we will be welcoming in 2014, and saying goodbye to 2013.    A very brief recap of the past few days action reflect that a new high was made on the SP-500 on Dec 27, 2013, attaining 1844.89 on the index.

The last few days have been on low volume, however I am always receptive to new highs on indexes, low volume or not.   Also, the I-Fund has flashed some strength, and the top funds, performance-wise, have been I-Fund and S-Fund over the past five days.

Allow me to say THANK  YOU to all of my loyal subscribers, for the great comments and words of support regarding this site.    While I do not claim to have a crystal ball or be able to guarantee performance returns, if this site has stimulated some proactive TSP management, and improved some folks returns, than I have accomplished a lot.   This site has seen huge subscriber growth in 2013, and this is largely due to word of mouth from the subscriber base.  One of my wishes for 2014 is further growth of my subscriber base, and the only way to accomplish this is via me, delivering a quality product to the subscriber, who in turn will refer this site to others.

Everybody have a safe holiday…from my family to your family:  Happy New Year. 

– Bill Pritchard


Dec 22 Update/ Merry Christmas Message

This past week in the markets was very good, with the S-Fund outperforming all funds, and C-Fund taking second place.     There are no indications that this performance will change anytime soon.   As we enter Christmas week, trading will be light, as the U.S. securities markets will be closed at noon CT on Tuesday, Dec. 24, closed on Wednesday, Dec. 25 for Christmas and closed on Jan. 1 2014 for New Years.  I personally don’t see any huge market volume or activity coming back until Monday, January 6, 2014.   In other words, December’s action, for all intents and purposes, is “over.”

On Friday, Dec 20, the SP 500 index closed up on huge volume, hitting a new 52 week high of 1823.75.  See Chart:

SP-500-12-22-13-comments

As reported in my November 5, 2013 post, December is historically the best performing month out of the year, and while it got off to a rough start, I am quite pleased on how things have turned out (again, December is basically done now, trading-wise).   

It should be noted that on Sunday, Dec 22, the International Monetary Fund (IMF) made news by stating that it believes that the US economy is expanding faster than previously thought, and expressed a positive outlook for 2014.   This news was via statements by IMF Director Lagarde, and not in the form of an official press release/etc.   However, this has the potential of lifting the markets even further.   Readers will recall my prior hospital patient analogy, regarding the recovering US economy, and not shocking is the fact that we are starting to see independent reports and data confirm my prior statements.  I had the pleasure of eating breakfast recently with a Regional VP (for my geographic area) of a major US shipping company (I won’t name it but they paint everything one color).  This person reports directly to the HQ in USA.  Sometimes field interviews are much better than fancy reports, charts, and economic theories, and being on the street is where you see what is really happening.  I asked him “how did 2013 work out” and “are things coming back, from your point of view” and his response was overwhelmingly a “yes.”    

I have had some great reader mails, thank you, and a few have asked the legit question “is the market’s run is almost over.”   This is based on the observation that the SP-500 Index has been in an uptrend since basically 2009.   While true, it has only really taken off since November 2012.   I base my opinion, on two things, the use of the 200-day Moving Average as a trend signal, and the price of gold.   The financial industry typically views a penetration or “touching” of the 200-day MA as being a bearish signal, reflecting that the market/index is not fully healthy.   As my chart (with comments) below shows, not until 2013, did the index NOT touch the 200-day MA the entire year.   See chart:

SP-500-200day-comments

In addition, I use the price of Gold as a secondary indicator (remember, the market itself is #1 indicator) as to how things are playing out.  Gold, is the “safe haven” for major market players in times of economic turmoil, war, or when fear is in the air.   Money is believed by some (me included) to be like fluids, and when fluid flows from one “container” (Gold, Bonds, Stocks, etc.) this means that it must flow to another container.   Students of fluid dynamics and system dynamics believe that one component of a system affects other components, similar to a heart which determines how fast your legs can run.  The heart may be more important than your leg muscle, and both need each other for a successful run.  With that said, many believe that money (fluid) leaves Gold when equities/stock markets are recovering, and further invests in stocks, thus sending them higher, and when stocks are doing bad, money goes elsewhere, to other investments such as Gold.  Gold is also important as it is the “default” currency, worldwide. 

The last major price peak of Gold occurred in October, 2012, and its price has been on a decline since, reflecting money outflows, and inflows into something else.  Note that since 2009 until October 2012, while the markets, yes, were up, Gold, also, was up, indicating that the world was not quite ready to dive head first into the stock markets.  In addition, 2009 up until Nov 2012, the SP 500 index had a couple of “rough patches” and violated the 200-day MA.    See Gold chart:

GOLD-comments

However this apparently changed in November 2012 (one month after the peak in Gold prices), as this was the start of a new uptrend in the SP 500 index, and in January 2013, after assessing the November and December behavior, and post-Fiscal Cliff resolution, I made the decision to return to the S-Fund.   Many of my readers have mirrored my TSP moves, and we all enjoyed a great 2013.   It is my opinion that the current bull market only “really” began in November 2012, and that 2014 is likely going to be a good year.

My TSP Allocation remains 50% S-Fund and 50% C-Fund.   I hope everyone has a Merry Christmas and Happy New Year, and I will see everybody after the holidays.  Thanks

– Bill Pritchard