
Hello folks
The last week of January is over, and the month was down, instead of up, in large part to the sell off which started in the last two weeks of January. The first trading day of February, Feb 3, is over, and it was not pretty, with the markets closing hard down and the Dow Jones Index loosing over 300 points by end of day. All indexes and sectors got creamed, large cap, small cap, international, nothing was immune.
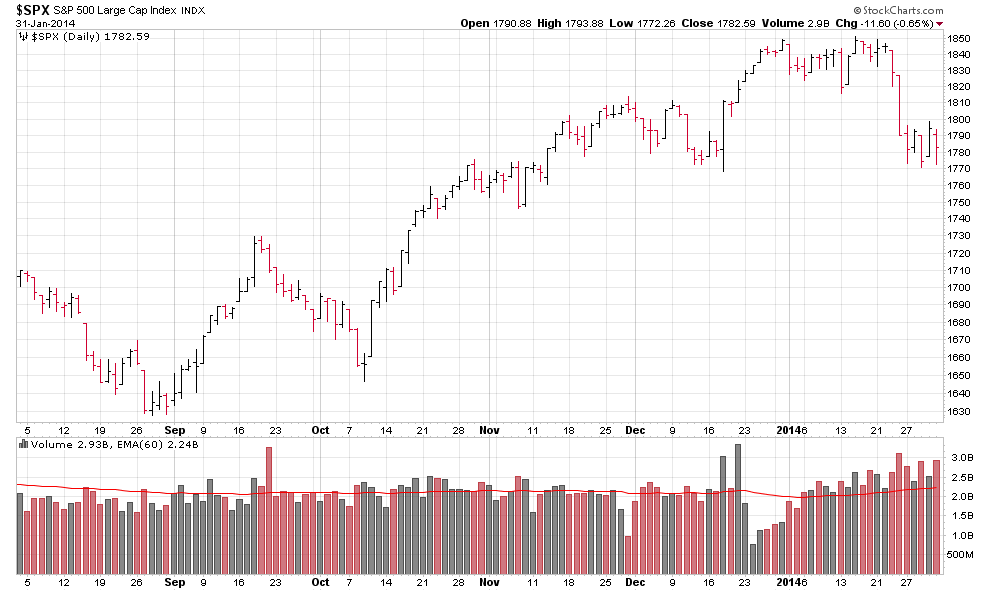
With the month of January now behind us, I am able to review the behavior of the SP 500 index (my “go to” index for assessing market behavior) and I have observed a possible Head and Shoulders Pattern developing. This pattern, if it occurs within the structure of a topping bull market, can be a very reliable indicator of a pending trend reversal. While no hard, set-in-stone, rules exist defining this pattern, it is generally accepted to be composed of a left shoulder, a head, and a right shoulder, with all of the above sitting on a “neckline.” The neckline currently is 1770 on the SP 500. NOTE: Due to evening data issues, charts on this update do not account for today’s action (it does not make a difference, today was down, not up). A picture-perfect head and shoulders pattern (H/S) should be 5 (five) months or longer in length, from left shoulder, thru the head, to the right shoulder, and the left shoulder and right shoulder typically, but not always, similar in size. Let’s take a look, see images and comments on the images:
Same image, with comments:
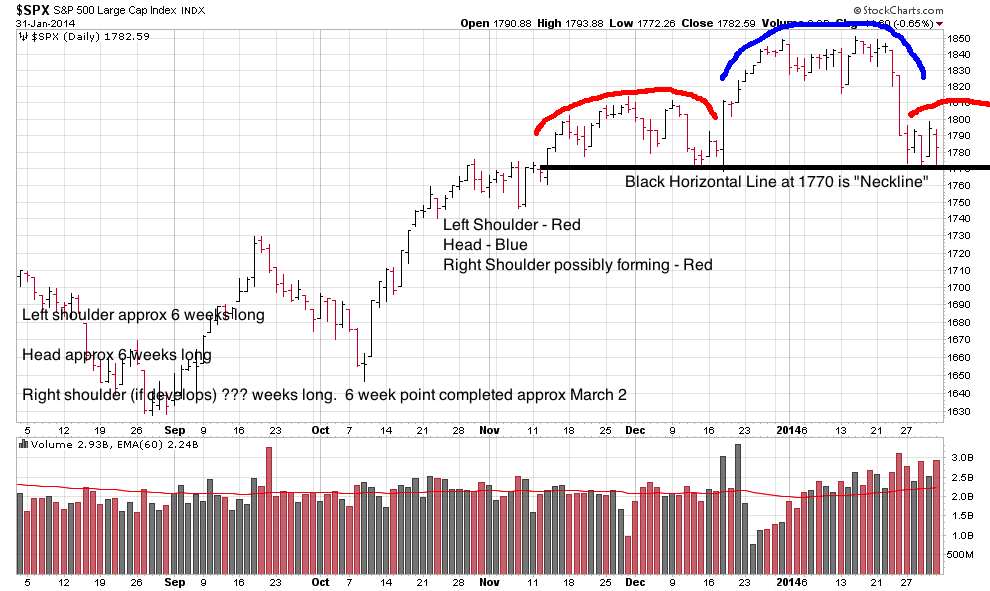
As can be seen, this pattern (which is not complete, the right shoulder is yet to be fully developed yet, we are too early in my opinion….) began to form on/about Nov 11, 2013. The 5 (five) month completion point will occur on/about April 11, 2014. Dates are approximate and as stated above, no hard rules exist for these patterns, because behind the pattern, is human behavior, which causes the pattern. With that said, the current left shoulder is six weeks long, the head is six weeks long, and the right shoulder began approx Jan 27, 2014. Again, the sizes do not have to be identical. The volume on this possible H/S pattern on does not meet the picture-perfect H/S volume criteria, likely due to some holidays in each of the last three months and reduced trading activity.
After the formation of the right shoulder, the “neckline” then gets violated to the downside (current still-being-formed neckline of 1770 was broken today Feb 3). Typically the market will rally back up to the neckline, and break down again, usually on huge volume, thus commencing a new downtrend and bear market. “False rallies” back up to the neckline will catch the uninformed and unwary, who blindly return to stocks, because the market “is coming back”, not knowing of the bloodbath lurking around the corner.
If this pattern continues to develop into a correctly formed H/S, we will see flatness and lack of uptrend for the next few weeks, and then a break downward, thus commencing a new downtrend. I am personally 100% in G-Fund, and captured the gains of Jan 30, 2014 on my way out the door, due to the two-day processing time for TSP change requests. My opinion is, I don’t know if I would be remaining in stock investments “just a little longer” in order to “see what happens”. Or “I am already down, might as well stay where I am at, no sense getting out now.” Let me put it to you this way, you are on a raid, and in the hallway, you take two rounds to your raid vest. And all indications are that the bullets are not going to stop coming. You gonna stay in the hallway, because “you already took two rounds” ? Didn’t think so.
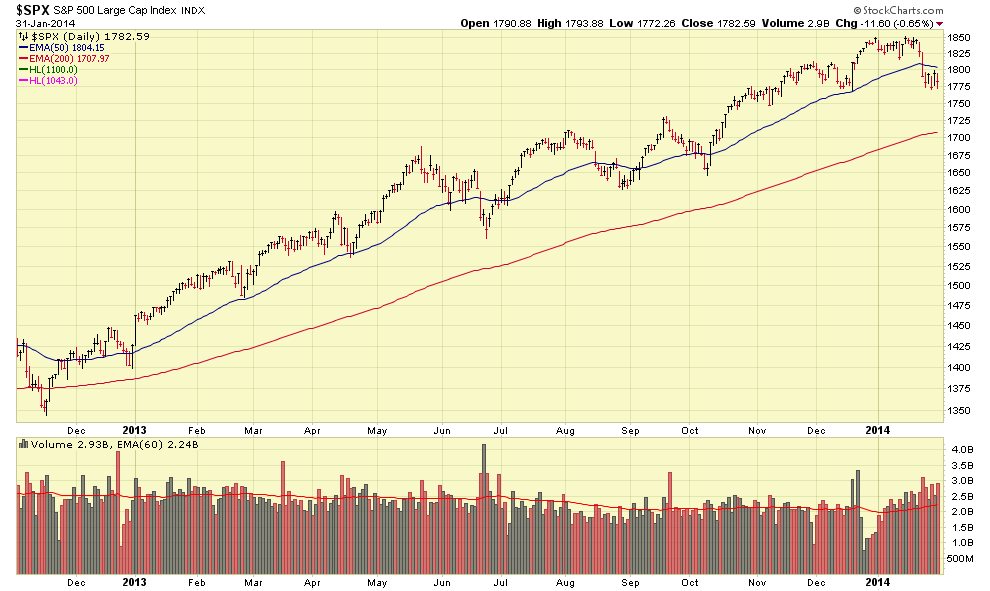
Taking a look at January, it can be seen that the index is still below the 50-day Moving Average, which is a commonly used trend indicator used by technical analysts and money managers. The index has gone below the 50-day in the past, during June, Aug, and October, but this time the January volume has been much higher than the prior 50-day violations. Let’s take a look:
Red circles indicate points of 50-day violation with attention called to volume on bottom of chart:
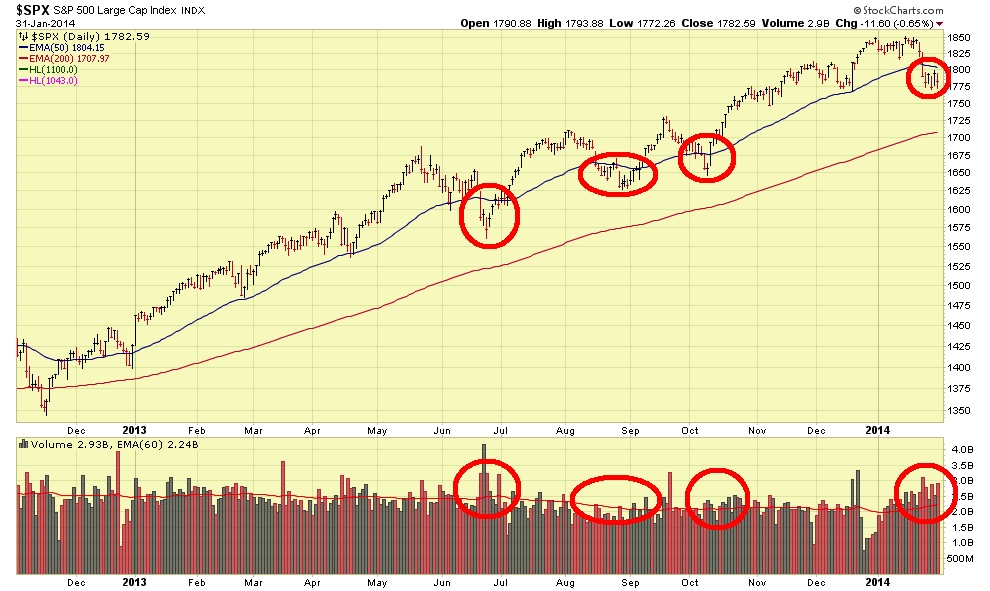
As can be seen, January’s volume definitely increased and was higher than prior occasions when the 50-day was violated to the downside. Volume is the “horsepower behind the move”, and any move up or down accompanied by high volume is highly credible. In other words, if something goes up or down on high volume, then the probability is high that it will continue to go up or down.
Let’s move to another topic, the January Barometer. As can be expected, some media outlets are bashing this indicator as being unreliable. I don’t know what to tell you, I mean, you gotta make your own decisions on what or who to believe. The developers of this indicator publish the Stock Market Almanac, I have purchased their products and dealt with the company, always had a positive experience. Nobody has a perfect crystal ball obviously, but I am a believer in their products and studies. Reliable, credible data reflects that the January Barometer is valid to the point that it should at least be a part of your toolbox. The market itself, is the ultimate signal, but I use some supplementals to assist me and the January Barometer is one of them. The theory behind the January barometer is that it “sets the tone” for the rest of the year. Anybody who watched the Super Bowl, probably said “wow, great start Broncos” as this picture unfolded (I know I did…) :
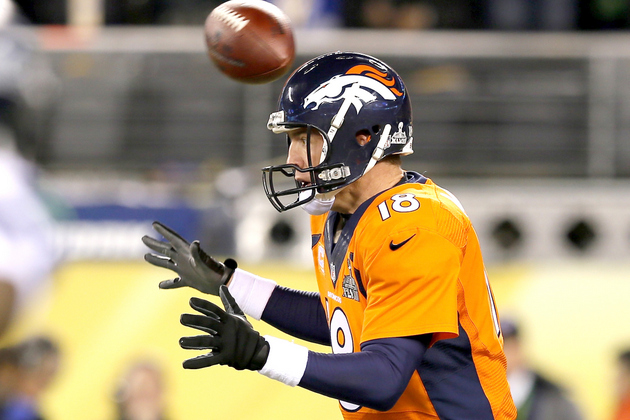
So are we to believe the January Barometer? You tell me. Worst January since 2012, and a very bad first day of February, and this behavior (remember, behind market moves, are people…) in the markets is just, not important ? Means nothing ? Was the “tone set” for the Broncos from the beginning ? A fairly basic action (a snap), in the earliest stages of the most important game of the year, bungled ? How much did Denver rehearse for this game ? Denver has been to the Super Bowl before, they know the drill. Is there any linkage between this being bungled, early in football’s most important game, to their huge loss to Seattle ? Did Denver “get started on the right foot” Etc ? Did this fuel or de-fuel Seattle’s already powerful confidence? In summary, you must form your own opinion on the January Barometer, which for me is a supplemental indicator to the primary signal, the market itself.
Having called everyone’s attention to the prior 50-day Moving Average violations, and my observation that the volume during January’s violation was much higher than on prior occasions, it is important to note that making headlines is the fact that the SP 500 recently had the longest weekly drop since 2012.
In summary, January was a difficult month, and far worse than any month going back to 2012. The first trading day of February was a disaster. Let’s see how February shapes up and hope the storm clouds clear up.
Due to my analysis and observations, and opinion that a new downtrend and possible bear market may be underway, all of which was discussed in my Jan 29 2014 posting, my TSP Allocation is 100% G-Fund. My preliminary review of similar TSP websites (many of which are paid membership sites of $150 or more annually) tells me that The Fed Trader has been the first, and currently, is the only site, which has provided timely forewarning of a possible downtrend. Folks have to be careful who to trust. If you can figure out the ownership behind many of these sites, typically associated to PO BOX’s and mysterious LLC’s, good for you. Here, I sign everything with my name, and if that is not enough, folks have my email and picture, in the event they go bankrupt or their TSP goes to zero based on my market analysis. Many in the audience know me or know someone who knows me, and can track me down to vent in person. Here, I believe in transparency and plain, easy to understand analysis, that my audience can relate to. Advice of the opposite type is common and they even made a movie about it. Just a heads-up as in the coming weeks, confusion and misinformation will be pumped out by the media outlets, investment websites, and major brokerages.
Talk to everybody soon, and thanks for reading………. – Bill Pritchard
