Hello Everyone
May 18, 2016 market action was disappointing, and directly tied to the Federal Open Market Committee (FOMC) minutes release which appeared to signal a possible rate hike in June. I say “appeared” because that is the consensus of the financial press, however I am not so convinced that a rate hike will occur. I encourage readers take a look at a prior post, on March 12, 2015, as almost a year later, I am posting a very similar analysis again.
First, most of the (often a paid subscription is required…) business and financial news sites on the evening of May 18, 2016 are publishing some iteration of “If the economy improves further, rates will go up.” I don’t know about you, but that reporting does not appear to be very earth-shattering. Unfortunately (why does that word seem to occupy most of my posts this year….?) the market, in recent typical fashion, over-reacted and at one point during the day the Dow was down triple digits. Fortunately, the indexes calmed down towards the end of the day, with the SP-500 actually closing slightly above its open price. Lets take a look at the one-day “intraday” chart of the SP-500, again, my default index:
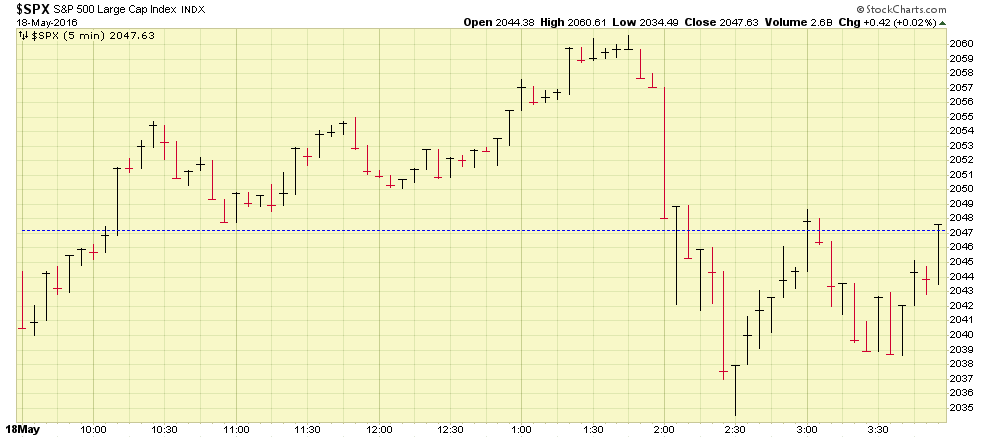
The violent downward action at the 2PM mark coincides with the FOMC minutes release. Traders were hitting “sell” and I don’t even think they were reading the release. However, I did read it (you can too…); allow me to share some views. Again, these are not unlike my views from 2015.
Let’s observe that since maybe 2014 (and definitely since 2015), the FOMC has set two benchmarks, which both must be met, in order for them to consider raising rates. The FOMC, and Ms. Yellen (the chairperson), has said these in numerous events, pubic press briefings, and to Congress. These benchmarks are:
- “Maximum Employment” – Unemployment Rate below 6.5% = desired, the lower the rate, the better, the closer to 6.5%, not so good
- Core 12-Month PCE Inflation (minus Food and Energy) Rate: 2%
We indeed have much improved unemployment rates, with the most recent data reflecting a 5% unemployment rate, however this rate is slightly worsened from prior months. The data for May unemployment will be released on June 3, 2016. See Image:
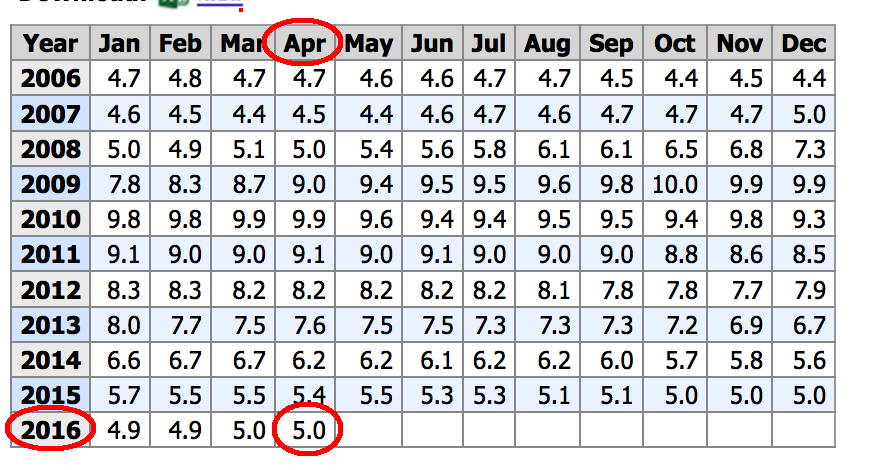
As can be seen, our unemployment rates have been mostly steady, since August, however “steady” also means that no huge improvements are happening either.
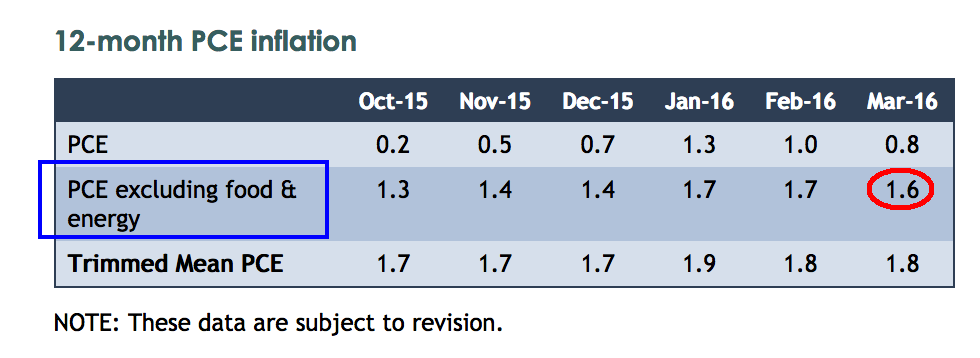
On to Core PCE Inflation, we are not at 2% yet, and as a matter of fact, it has drifted (slightly) the wrong direction, from 1.7% to 1.6%. See Image:
If you read the FOMC Minutes, a comment is made that “Over the 12 months ending in March, total consumer prices as measured by the consumer price index (CPI) rose 1 percent, while core CPI inflation was 2-1/4 percent. In light of the CPI data, both total and core PCE price inflation on a 12-month basis appeared to slow a bit in March.”
A reference to the desired 2 percent level is also mentioned:
“The 12-month change in core PCE prices also continued to run below 2 percent, but it moved up to 1.7 percent in January and February from 1.4 percent at the end of 2015. Despite the recent rise in core inflation, some participants continued to see progress toward the Committee’s 2 percent inflation objective as likely to be gradual….”
“…Still, with 12-month PCE inflation continuing to run below the Committee’s 2 percent objective, a number of participants judged that it would be appropriate to proceed cautiously in removing policy accommodation….”
The FOMC discussed many items in the minutes, from housing, to energy prices, to GDP, but if we are to follow the benchmarks above, which the FOMC is already on record as being the requirements prior to a rate hike, then we do indeed have the unemployment benchmark met, but we do not have the Core PCE benchmark met.
Add in the fact that we are in “election season”, I am not so sure that the President Obama-appointed Fed Chairperson Yellen and also-appointed Vice-Chairperson Fisher want to support a rate hike this summer, June or after. A rate hike will likely cause some turmoil in the markets (temporary or not, we don’t know) , turmoil which may be remembered at the voting machines. Not getting into politics, but it is what it is.
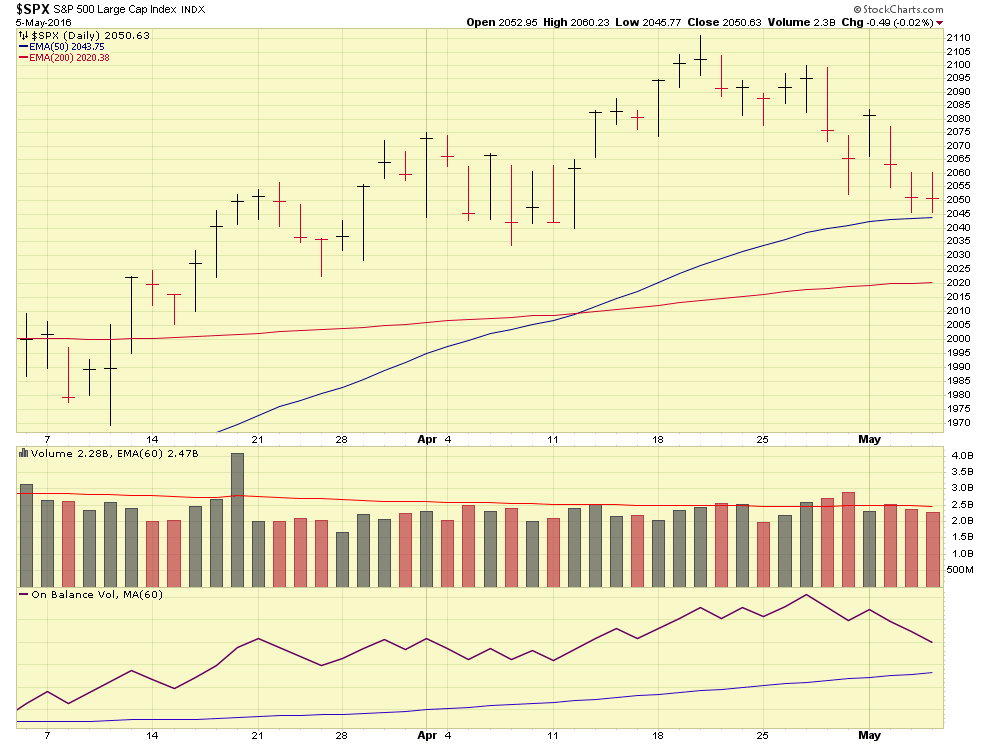
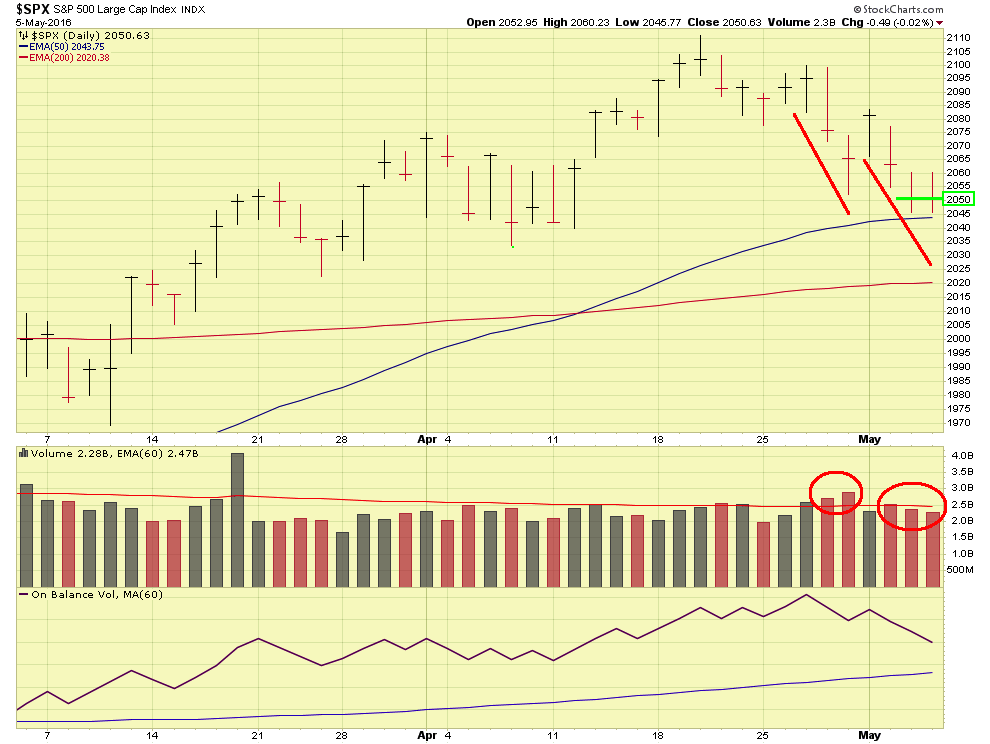
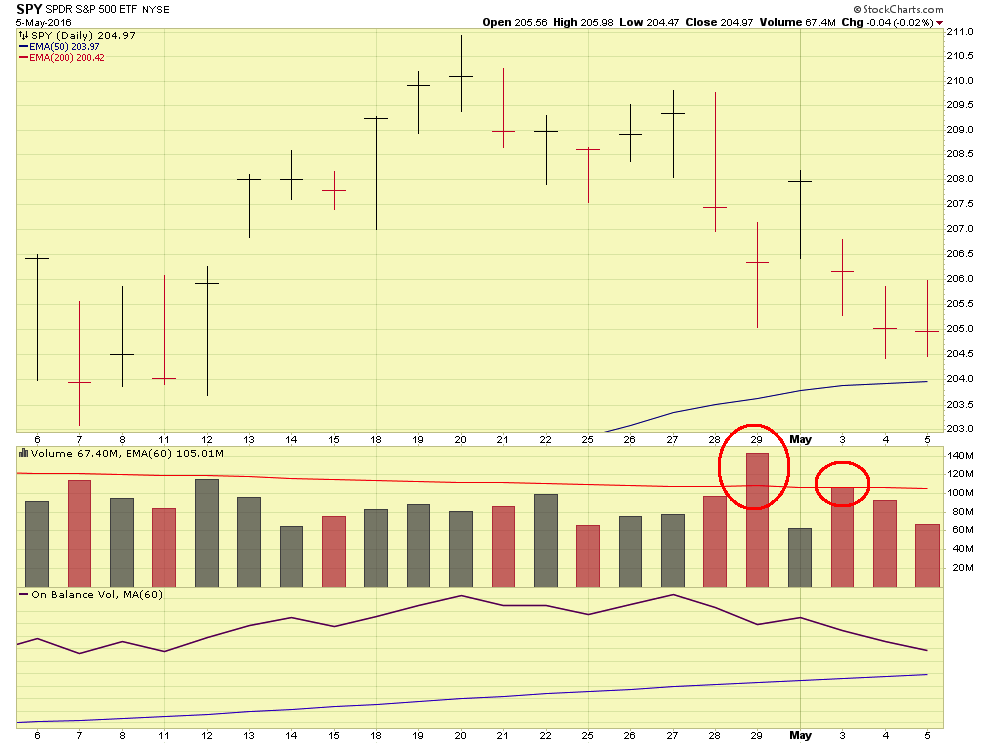
Let’s take a quick look at the recent SP-500 chart as we close out this update:
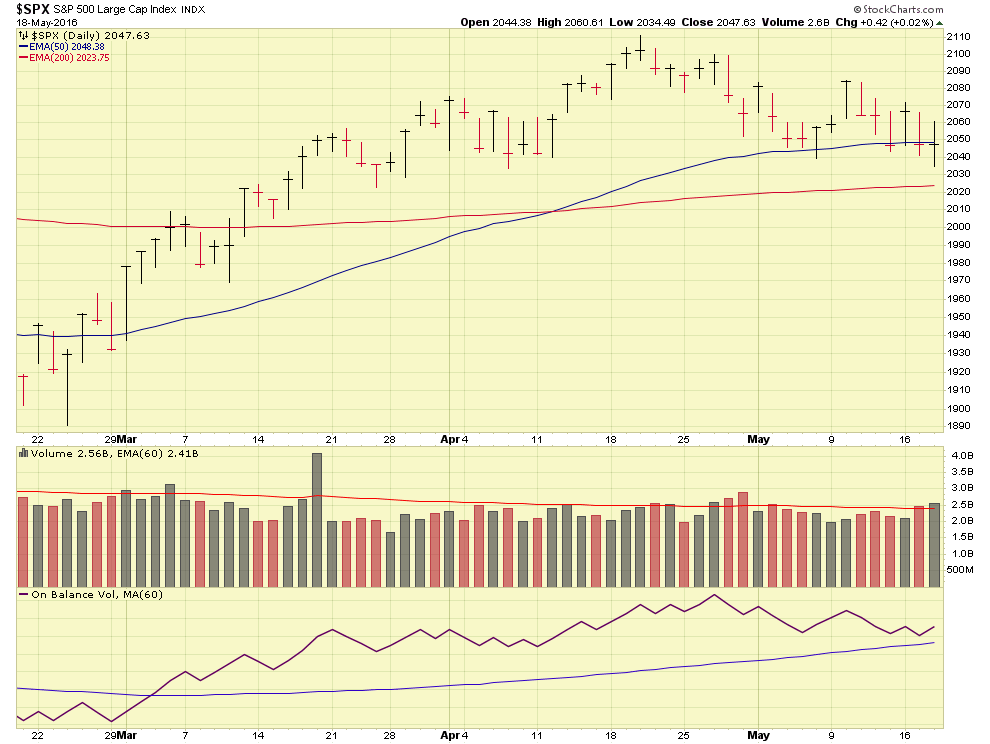
Apparent in the chart is that the sideways action continues, with the 2050 level remaining an important area for the index. The close on May 18, 2016 was 2047.63, slightly below 2050 but much recovered from its intraday low of 2034.49. Fortunately things improved in the afternoon. Nobody said investing (or trading) was easy, and the last few years, say mid-2014 until present, have been especially challenging.
Before I close this recent iteration of my unofficial ongoing two-week cycle of updates, some important calendar dates are as follows:
June 3: Unemployment Rate Data. Will it improve or worsen ?
June 6: FOMC Chairperson Yellen speaks in Philadelphia, and possibly offers a glimpse into the next event:
June 14-15: FOMC Meeting, possible action to increase interest rates.
As some say, these are “Exciting Times.” For now, I continue to be 50% S-Fund and 50% C-Fund in my TSP account. The market itself remains the ultimate thermometer, not outside news, noise, or events. If one or two triggers are driving the market, it indeed is important to understand those triggers. But I am not going to overload you (or myself) with inane economic data or try to use lumber sales at Home Depot to predict the housing cycle. I just don’t think it is useful or effective. Lets stick to our bread and butter, and monitor the volume and price action, and keep an eye on the 2050 level.
Thanks for reading and talk to you soon….
-Bill Pritchard